Russian vs Bolivian Hearing Disability
COMPARE
Russian
Bolivian
Hearing Disability
Hearing Disability Comparison
Russians
Bolivians
3.2%
HEARING DISABILITY
7.1/ 100
METRIC RATING
217th/ 347
METRIC RANK
2.6%
HEARING DISABILITY
99.7/ 100
METRIC RATING
29th/ 347
METRIC RANK
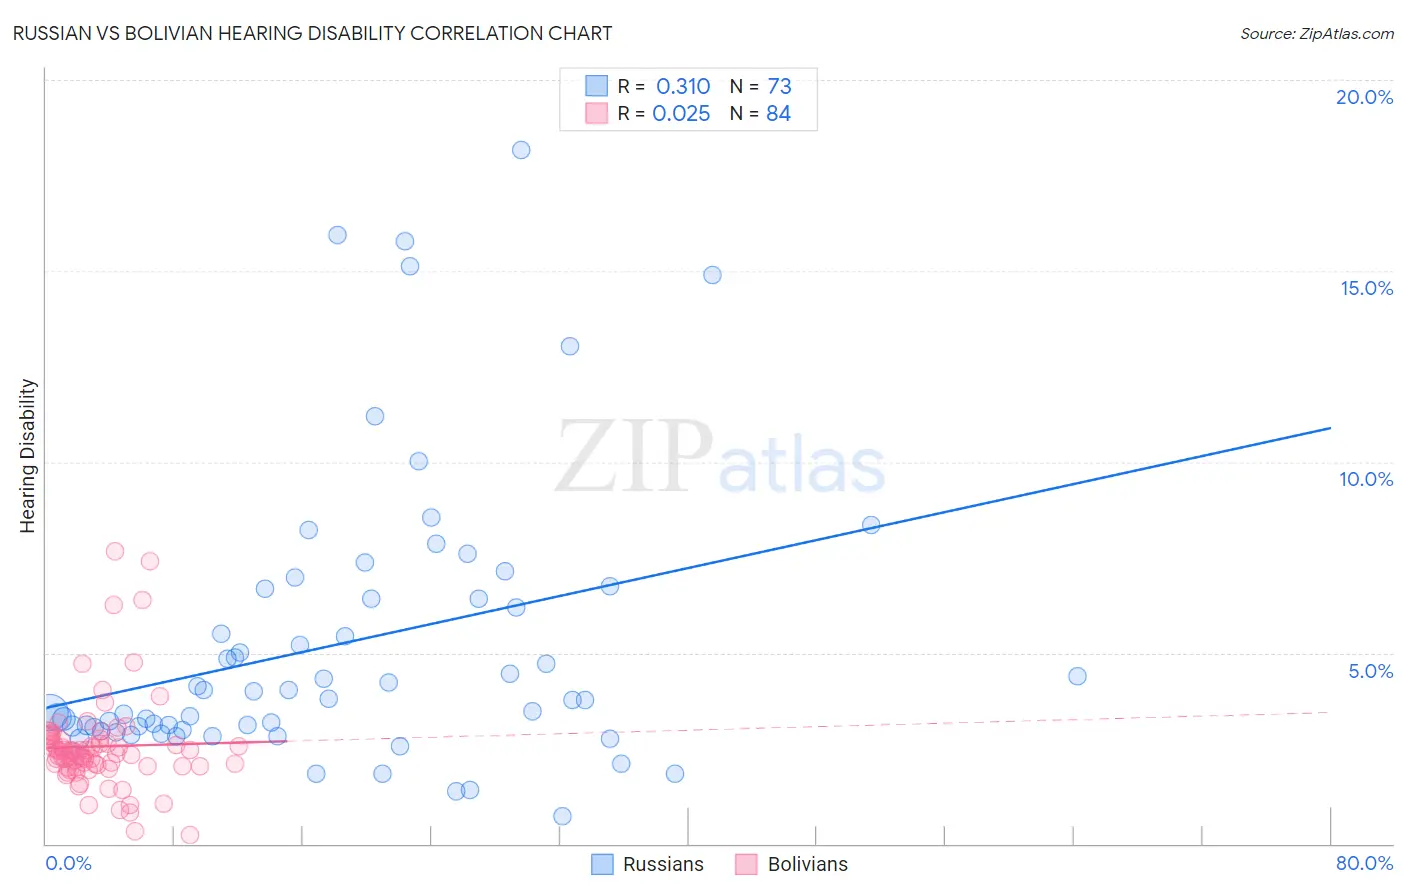
Russian vs Bolivian Hearing Disability Correlation Chart
The statistical analysis conducted on geographies consisting of 511,868,935 people shows a mild positive correlation between the proportion of Russians and percentage of population with hearing disability in the United States with a correlation coefficient (R) of 0.310 and weighted average of 3.2%. Similarly, the statistical analysis conducted on geographies consisting of 184,637,856 people shows no correlation between the proportion of Bolivians and percentage of population with hearing disability in the United States with a correlation coefficient (R) of 0.025 and weighted average of 2.6%, a difference of 22.5%.
Hearing Disability Correlation Summary
| Measurement | Russian | Bolivian |
| Minimum | 0.73% | 0.24% |
| Maximum | 18.2% | 7.7% |
| Range | 17.5% | 7.4% |
| Mean | 5.2% | 2.5% |
| Median | 3.8% | 2.4% |
| Interquartile 25% (IQ1) | 3.0% | 2.0% |
| Interquartile 75% (IQ3) | 6.5% | 2.7% |
| Interquartile Range (IQR) | 3.5% | 0.70% |
| Standard Deviation (Sample) | 3.7% | 1.2% |
| Standard Deviation (Population) | 3.7% | 1.2% |
Similar Demographics by Hearing Disability
Demographics Similar to Russians by Hearing Disability
In terms of hearing disability, the demographic groups most similar to Russians are Immigrants from Northern Europe (3.2%, a difference of 0.040%), Immigrants from Norway (3.2%, a difference of 0.080%), New Zealander (3.2%, a difference of 0.10%), Malaysian (3.2%, a difference of 0.16%), and Immigrants from Laos (3.2%, a difference of 0.16%).
| Demographics | Rating | Rank | Hearing Disability |
| Cape Verdeans | 12.2 /100 | #210 | Poor 3.1% |
| Romanians | 12.1 /100 | #211 | Poor 3.1% |
| Pakistanis | 11.1 /100 | #212 | Poor 3.1% |
| Immigrants | Iraq | 10.5 /100 | #213 | Poor 3.1% |
| Australians | 8.1 /100 | #214 | Tragic 3.2% |
| Bangladeshis | 8.1 /100 | #215 | Tragic 3.2% |
| Immigrants | Norway | 7.3 /100 | #216 | Tragic 3.2% |
| Russians | 7.1 /100 | #217 | Tragic 3.2% |
| Immigrants | Northern Europe | 7.0 /100 | #218 | Tragic 3.2% |
| New Zealanders | 6.8 /100 | #219 | Tragic 3.2% |
| Malaysians | 6.6 /100 | #220 | Tragic 3.2% |
| Immigrants | Laos | 6.6 /100 | #221 | Tragic 3.2% |
| Immigrants | Oceania | 6.5 /100 | #222 | Tragic 3.2% |
| Mexicans | 5.6 /100 | #223 | Tragic 3.2% |
| Icelanders | 5.2 /100 | #224 | Tragic 3.2% |
Demographics Similar to Bolivians by Hearing Disability
In terms of hearing disability, the demographic groups most similar to Bolivians are Immigrants from Haiti (2.6%, a difference of 0.020%), Immigrants from Caribbean (2.6%, a difference of 0.080%), Immigrants from Cameroon (2.6%, a difference of 0.090%), Immigrants from Venezuela (2.6%, a difference of 0.23%), and Immigrants from South Central Asia (2.6%, a difference of 0.40%).
| Demographics | Rating | Rank | Hearing Disability |
| Immigrants | Sierra Leone | 99.8 /100 | #22 | Exceptional 2.6% |
| Immigrants | Nigeria | 99.8 /100 | #23 | Exceptional 2.6% |
| Immigrants | Ghana | 99.8 /100 | #24 | Exceptional 2.6% |
| Immigrants | El Salvador | 99.7 /100 | #25 | Exceptional 2.6% |
| Immigrants | Senegal | 99.7 /100 | #26 | Exceptional 2.6% |
| Immigrants | South Central Asia | 99.7 /100 | #27 | Exceptional 2.6% |
| Immigrants | Haiti | 99.7 /100 | #28 | Exceptional 2.6% |
| Bolivians | 99.7 /100 | #29 | Exceptional 2.6% |
| Immigrants | Caribbean | 99.7 /100 | #30 | Exceptional 2.6% |
| Immigrants | Cameroon | 99.7 /100 | #31 | Exceptional 2.6% |
| Immigrants | Venezuela | 99.7 /100 | #32 | Exceptional 2.6% |
| Filipinos | 99.6 /100 | #33 | Exceptional 2.6% |
| Immigrants | Pakistan | 99.6 /100 | #34 | Exceptional 2.6% |
| Salvadorans | 99.6 /100 | #35 | Exceptional 2.6% |
| Okinawans | 99.6 /100 | #36 | Exceptional 2.6% |