Immigrants from Japan vs Immigrants from Syria Hearing Disability
COMPARE
Immigrants from Japan
Immigrants from Syria
Hearing Disability
Hearing Disability Comparison
Immigrants from Japan
Immigrants from Syria
2.9%
HEARING DISABILITY
66.3/ 100
METRIC RATING
162nd/ 347
METRIC RANK
2.9%
HEARING DISABILITY
85.8/ 100
METRIC RATING
133rd/ 347
METRIC RANK
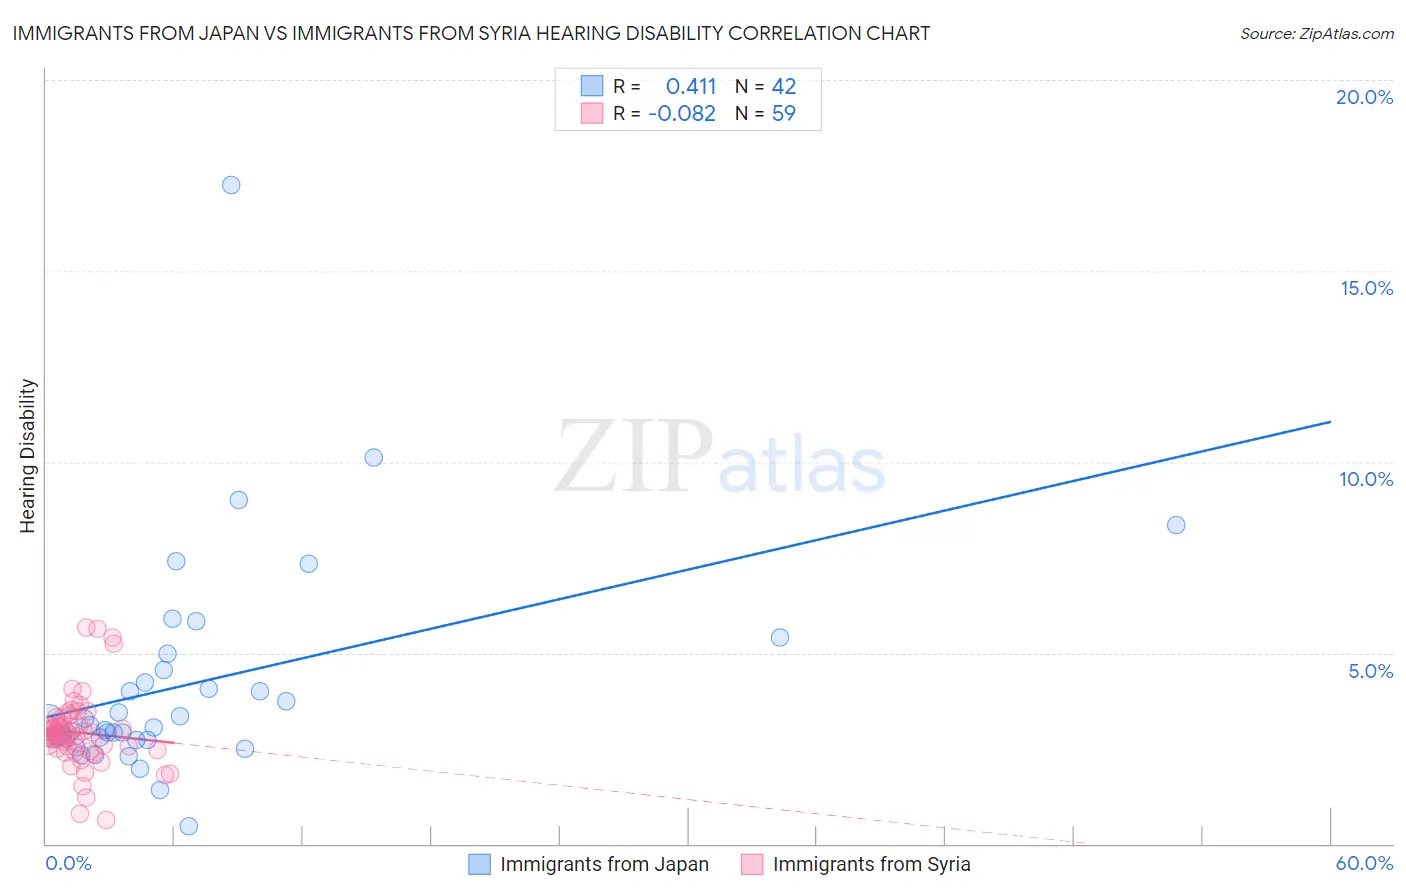
Immigrants from Japan vs Immigrants from Syria Hearing Disability Correlation Chart
The statistical analysis conducted on geographies consisting of 340,074,925 people shows a moderate positive correlation between the proportion of Immigrants from Japan and percentage of population with hearing disability in the United States with a correlation coefficient (R) of 0.411 and weighted average of 2.9%. Similarly, the statistical analysis conducted on geographies consisting of 174,100,459 people shows a slight negative correlation between the proportion of Immigrants from Syria and percentage of population with hearing disability in the United States with a correlation coefficient (R) of -0.082 and weighted average of 2.9%, a difference of 2.8%.
Hearing Disability Correlation Summary
| Measurement | Immigrants from Japan | Immigrants from Syria |
| Minimum | 0.47% | 0.64% |
| Maximum | 17.2% | 5.7% |
| Range | 16.8% | 5.0% |
| Mean | 4.2% | 2.9% |
| Median | 3.1% | 2.9% |
| Interquartile 25% (IQ1) | 2.7% | 2.5% |
| Interquartile 75% (IQ3) | 4.6% | 3.3% |
| Interquartile Range (IQR) | 1.8% | 0.85% |
| Standard Deviation (Sample) | 2.9% | 0.97% |
| Standard Deviation (Population) | 2.9% | 0.96% |
Similar Demographics by Hearing Disability
Demographics Similar to Immigrants from Japan by Hearing Disability
In terms of hearing disability, the demographic groups most similar to Immigrants from Japan are Albanian (2.9%, a difference of 0.030%), Immigrants from Fiji (2.9%, a difference of 0.090%), Immigrants from Australia (2.9%, a difference of 0.11%), Immigrants from Central America (3.0%, a difference of 0.15%), and Immigrants from Cambodia (3.0%, a difference of 0.16%).
| Demographics | Rating | Rank | Hearing Disability |
| Costa Ricans | 71.4 /100 | #155 | Good 2.9% |
| Immigrants | Poland | 70.2 /100 | #156 | Good 2.9% |
| Immigrants | Kazakhstan | 69.6 /100 | #157 | Good 2.9% |
| Immigrants | Burma/Myanmar | 69.5 /100 | #158 | Good 2.9% |
| Immigrants | Australia | 67.4 /100 | #159 | Good 2.9% |
| Immigrants | Fiji | 67.1 /100 | #160 | Good 2.9% |
| Albanians | 66.6 /100 | #161 | Good 2.9% |
| Immigrants | Japan | 66.3 /100 | #162 | Good 2.9% |
| Immigrants | Central America | 64.9 /100 | #163 | Good 3.0% |
| Immigrants | Cambodia | 64.8 /100 | #164 | Good 3.0% |
| Immigrants | Zimbabwe | 64.2 /100 | #165 | Good 3.0% |
| Immigrants | South Eastern Asia | 62.9 /100 | #166 | Good 3.0% |
| Immigrants | Eastern Europe | 58.1 /100 | #167 | Average 3.0% |
| Immigrants | Greece | 57.9 /100 | #168 | Average 3.0% |
| Arabs | 57.6 /100 | #169 | Average 3.0% |
Demographics Similar to Immigrants from Syria by Hearing Disability
In terms of hearing disability, the demographic groups most similar to Immigrants from Syria are Chilean (2.9%, a difference of 0.0%), Immigrants from Kenya (2.9%, a difference of 0.060%), Ugandan (2.9%, a difference of 0.070%), Immigrants from Vietnam (2.9%, a difference of 0.14%), and Immigrants from Uganda (2.9%, a difference of 0.16%).
| Demographics | Rating | Rank | Hearing Disability |
| Immigrants | Sudan | 87.8 /100 | #126 | Excellent 2.9% |
| South American Indians | 86.9 /100 | #127 | Excellent 2.9% |
| Immigrants | Western Asia | 86.9 /100 | #128 | Excellent 2.9% |
| Immigrants | Uganda | 86.6 /100 | #129 | Excellent 2.9% |
| Immigrants | Vietnam | 86.5 /100 | #130 | Excellent 2.9% |
| Immigrants | Kenya | 86.1 /100 | #131 | Excellent 2.9% |
| Chileans | 85.8 /100 | #132 | Excellent 2.9% |
| Immigrants | Syria | 85.8 /100 | #133 | Excellent 2.9% |
| Ugandans | 85.5 /100 | #134 | Excellent 2.9% |
| Soviet Union | 84.8 /100 | #135 | Excellent 2.9% |
| Immigrants | Brazil | 84.6 /100 | #136 | Excellent 2.9% |
| Sri Lankans | 84.1 /100 | #137 | Excellent 2.9% |
| Immigrants | Costa Rica | 84.0 /100 | #138 | Excellent 2.9% |
| Bermudans | 83.8 /100 | #139 | Excellent 2.9% |
| Immigrants | Jordan | 83.7 /100 | #140 | Excellent 2.9% |