Eastern European vs Immigrants from Syria Hearing Disability
COMPARE
Eastern European
Immigrants from Syria
Hearing Disability
Hearing Disability Comparison
Eastern Europeans
Immigrants from Syria
3.1%
HEARING DISABILITY
15.5/ 100
METRIC RATING
206th/ 347
METRIC RANK
2.9%
HEARING DISABILITY
85.8/ 100
METRIC RATING
133rd/ 347
METRIC RANK
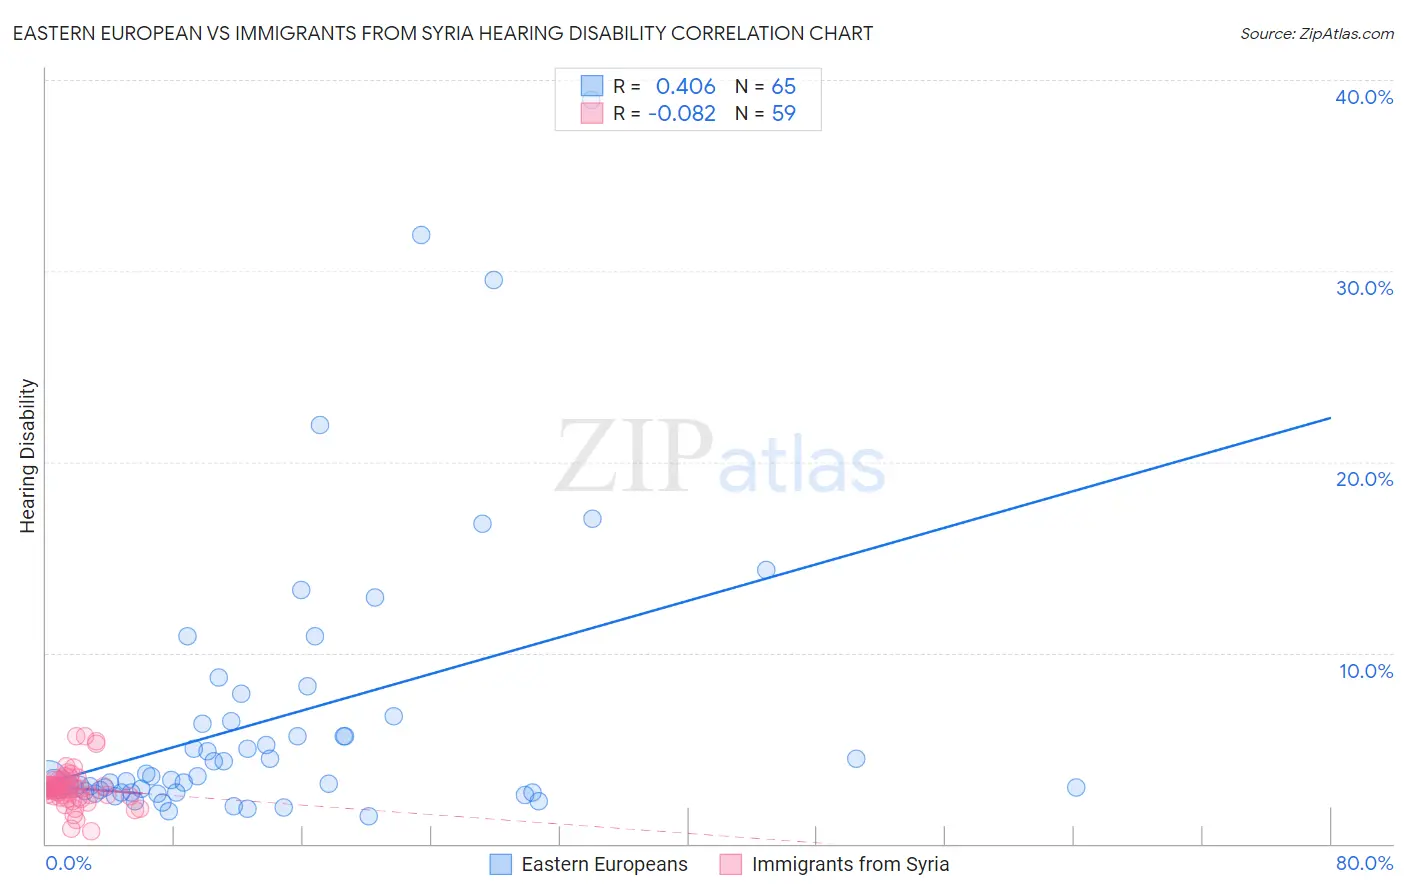
Eastern European vs Immigrants from Syria Hearing Disability Correlation Chart
The statistical analysis conducted on geographies consisting of 461,059,172 people shows a moderate positive correlation between the proportion of Eastern Europeans and percentage of population with hearing disability in the United States with a correlation coefficient (R) of 0.406 and weighted average of 3.1%. Similarly, the statistical analysis conducted on geographies consisting of 174,100,459 people shows a slight negative correlation between the proportion of Immigrants from Syria and percentage of population with hearing disability in the United States with a correlation coefficient (R) of -0.082 and weighted average of 2.9%, a difference of 8.6%.
Hearing Disability Correlation Summary
| Measurement | Eastern European | Immigrants from Syria |
| Minimum | 1.4% | 0.64% |
| Maximum | 39.0% | 5.7% |
| Range | 37.5% | 5.0% |
| Mean | 6.5% | 2.9% |
| Median | 3.4% | 2.9% |
| Interquartile 25% (IQ1) | 2.7% | 2.5% |
| Interquartile 75% (IQ3) | 6.4% | 3.3% |
| Interquartile Range (IQR) | 3.6% | 0.85% |
| Standard Deviation (Sample) | 7.3% | 0.97% |
| Standard Deviation (Population) | 7.3% | 0.96% |
Similar Demographics by Hearing Disability
Demographics Similar to Eastern Europeans by Hearing Disability
In terms of hearing disability, the demographic groups most similar to Eastern Europeans are Immigrants from Czechoslovakia (3.1%, a difference of 0.070%), Alsatian (3.1%, a difference of 0.070%), Hispanic or Latino (3.1%, a difference of 0.070%), Immigrants from Denmark (3.1%, a difference of 0.12%), and Immigrants from Thailand (3.1%, a difference of 0.16%).
| Demographics | Rating | Rank | Hearing Disability |
| Syrians | 19.2 /100 | #199 | Poor 3.1% |
| Immigrants | North Macedonia | 19.1 /100 | #200 | Poor 3.1% |
| Iraqis | 19.0 /100 | #201 | Poor 3.1% |
| Immigrants | Thailand | 16.4 /100 | #202 | Poor 3.1% |
| Immigrants | Denmark | 16.2 /100 | #203 | Poor 3.1% |
| Immigrants | Czechoslovakia | 15.9 /100 | #204 | Poor 3.1% |
| Alsatians | 15.9 /100 | #205 | Poor 3.1% |
| Eastern Europeans | 15.5 /100 | #206 | Poor 3.1% |
| Hispanics or Latinos | 15.1 /100 | #207 | Poor 3.1% |
| Immigrants | Latvia | 12.7 /100 | #208 | Poor 3.1% |
| Immigrants | Hungary | 12.5 /100 | #209 | Poor 3.1% |
| Cape Verdeans | 12.2 /100 | #210 | Poor 3.1% |
| Romanians | 12.1 /100 | #211 | Poor 3.1% |
| Pakistanis | 11.1 /100 | #212 | Poor 3.1% |
| Immigrants | Iraq | 10.5 /100 | #213 | Poor 3.1% |
Demographics Similar to Immigrants from Syria by Hearing Disability
In terms of hearing disability, the demographic groups most similar to Immigrants from Syria are Chilean (2.9%, a difference of 0.0%), Immigrants from Kenya (2.9%, a difference of 0.060%), Ugandan (2.9%, a difference of 0.070%), Immigrants from Vietnam (2.9%, a difference of 0.14%), and Immigrants from Uganda (2.9%, a difference of 0.16%).
| Demographics | Rating | Rank | Hearing Disability |
| Immigrants | Sudan | 87.8 /100 | #126 | Excellent 2.9% |
| South American Indians | 86.9 /100 | #127 | Excellent 2.9% |
| Immigrants | Western Asia | 86.9 /100 | #128 | Excellent 2.9% |
| Immigrants | Uganda | 86.6 /100 | #129 | Excellent 2.9% |
| Immigrants | Vietnam | 86.5 /100 | #130 | Excellent 2.9% |
| Immigrants | Kenya | 86.1 /100 | #131 | Excellent 2.9% |
| Chileans | 85.8 /100 | #132 | Excellent 2.9% |
| Immigrants | Syria | 85.8 /100 | #133 | Excellent 2.9% |
| Ugandans | 85.5 /100 | #134 | Excellent 2.9% |
| Soviet Union | 84.8 /100 | #135 | Excellent 2.9% |
| Immigrants | Brazil | 84.6 /100 | #136 | Excellent 2.9% |
| Sri Lankans | 84.1 /100 | #137 | Excellent 2.9% |
| Immigrants | Costa Rica | 84.0 /100 | #138 | Excellent 2.9% |
| Bermudans | 83.8 /100 | #139 | Excellent 2.9% |
| Immigrants | Jordan | 83.7 /100 | #140 | Excellent 2.9% |