Russian vs Jamaican Hearing Disability
COMPARE
Russian
Jamaican
Hearing Disability
Hearing Disability Comparison
Russians
Jamaicans
3.2%
HEARING DISABILITY
7.1/ 100
METRIC RATING
217th/ 347
METRIC RANK
2.7%
HEARING DISABILITY
99.0/ 100
METRIC RATING
52nd/ 347
METRIC RANK
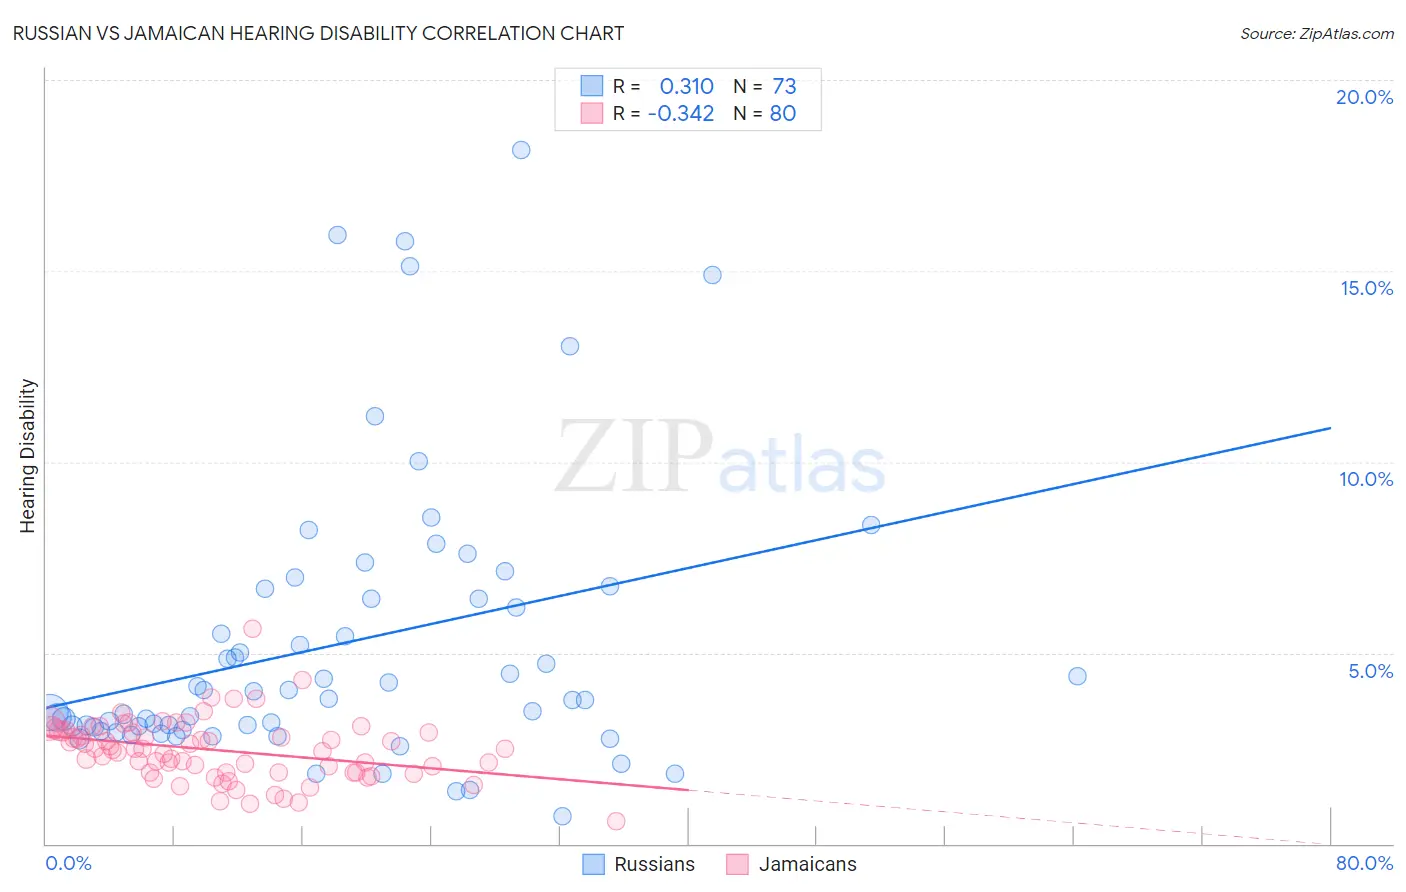
Russian vs Jamaican Hearing Disability Correlation Chart
The statistical analysis conducted on geographies consisting of 511,868,935 people shows a mild positive correlation between the proportion of Russians and percentage of population with hearing disability in the United States with a correlation coefficient (R) of 0.310 and weighted average of 3.2%. Similarly, the statistical analysis conducted on geographies consisting of 367,784,846 people shows a mild negative correlation between the proportion of Jamaicans and percentage of population with hearing disability in the United States with a correlation coefficient (R) of -0.342 and weighted average of 2.7%, a difference of 19.0%.
Hearing Disability Correlation Summary
| Measurement | Russian | Jamaican |
| Minimum | 0.73% | 0.58% |
| Maximum | 18.2% | 5.6% |
| Range | 17.5% | 5.0% |
| Mean | 5.2% | 2.5% |
| Median | 3.8% | 2.5% |
| Interquartile 25% (IQ1) | 3.0% | 1.9% |
| Interquartile 75% (IQ3) | 6.5% | 3.0% |
| Interquartile Range (IQR) | 3.5% | 1.1% |
| Standard Deviation (Sample) | 3.7% | 0.80% |
| Standard Deviation (Population) | 3.7% | 0.80% |
Similar Demographics by Hearing Disability
Demographics Similar to Russians by Hearing Disability
In terms of hearing disability, the demographic groups most similar to Russians are Immigrants from Northern Europe (3.2%, a difference of 0.040%), Immigrants from Norway (3.2%, a difference of 0.080%), New Zealander (3.2%, a difference of 0.10%), Malaysian (3.2%, a difference of 0.16%), and Immigrants from Laos (3.2%, a difference of 0.16%).
| Demographics | Rating | Rank | Hearing Disability |
| Cape Verdeans | 12.2 /100 | #210 | Poor 3.1% |
| Romanians | 12.1 /100 | #211 | Poor 3.1% |
| Pakistanis | 11.1 /100 | #212 | Poor 3.1% |
| Immigrants | Iraq | 10.5 /100 | #213 | Poor 3.1% |
| Australians | 8.1 /100 | #214 | Tragic 3.2% |
| Bangladeshis | 8.1 /100 | #215 | Tragic 3.2% |
| Immigrants | Norway | 7.3 /100 | #216 | Tragic 3.2% |
| Russians | 7.1 /100 | #217 | Tragic 3.2% |
| Immigrants | Northern Europe | 7.0 /100 | #218 | Tragic 3.2% |
| New Zealanders | 6.8 /100 | #219 | Tragic 3.2% |
| Malaysians | 6.6 /100 | #220 | Tragic 3.2% |
| Immigrants | Laos | 6.6 /100 | #221 | Tragic 3.2% |
| Immigrants | Oceania | 6.5 /100 | #222 | Tragic 3.2% |
| Mexicans | 5.6 /100 | #223 | Tragic 3.2% |
| Icelanders | 5.2 /100 | #224 | Tragic 3.2% |
Demographics Similar to Jamaicans by Hearing Disability
In terms of hearing disability, the demographic groups most similar to Jamaicans are Immigrants from Eastern Asia (2.7%, a difference of 0.070%), Ethiopian (2.7%, a difference of 0.10%), Immigrants from Ethiopia (2.7%, a difference of 0.16%), Immigrants from Nicaragua (2.7%, a difference of 0.19%), and South American (2.7%, a difference of 0.23%).
| Demographics | Rating | Rank | Hearing Disability |
| Venezuelans | 99.4 /100 | #45 | Exceptional 2.6% |
| Immigrants | Dominica | 99.3 /100 | #46 | Exceptional 2.6% |
| Immigrants | Israel | 99.3 /100 | #47 | Exceptional 2.6% |
| Immigrants | Singapore | 99.3 /100 | #48 | Exceptional 2.6% |
| Immigrants | South America | 99.2 /100 | #49 | Exceptional 2.7% |
| Paraguayans | 99.2 /100 | #50 | Exceptional 2.7% |
| Immigrants | Hong Kong | 99.2 /100 | #51 | Exceptional 2.7% |
| Jamaicans | 99.0 /100 | #52 | Exceptional 2.7% |
| Immigrants | Eastern Asia | 99.0 /100 | #53 | Exceptional 2.7% |
| Ethiopians | 99.0 /100 | #54 | Exceptional 2.7% |
| Immigrants | Ethiopia | 99.0 /100 | #55 | Exceptional 2.7% |
| Immigrants | Nicaragua | 99.0 /100 | #56 | Exceptional 2.7% |
| South Americans | 99.0 /100 | #57 | Exceptional 2.7% |
| Immigrants | Peru | 98.6 /100 | #58 | Exceptional 2.7% |
| Immigrants | Eritrea | 98.5 /100 | #59 | Exceptional 2.7% |