Afghan vs Immigrants from Northern Africa Female Disability
COMPARE
Afghan
Immigrants from Northern Africa
Female Disability
Female Disability Comparison
Afghans
Immigrants from Northern Africa
11.2%
FEMALE DISABILITY
100.0/ 100
METRIC RATING
43rd/ 347
METRIC RANK
11.5%
FEMALE DISABILITY
99.8/ 100
METRIC RATING
68th/ 347
METRIC RANK
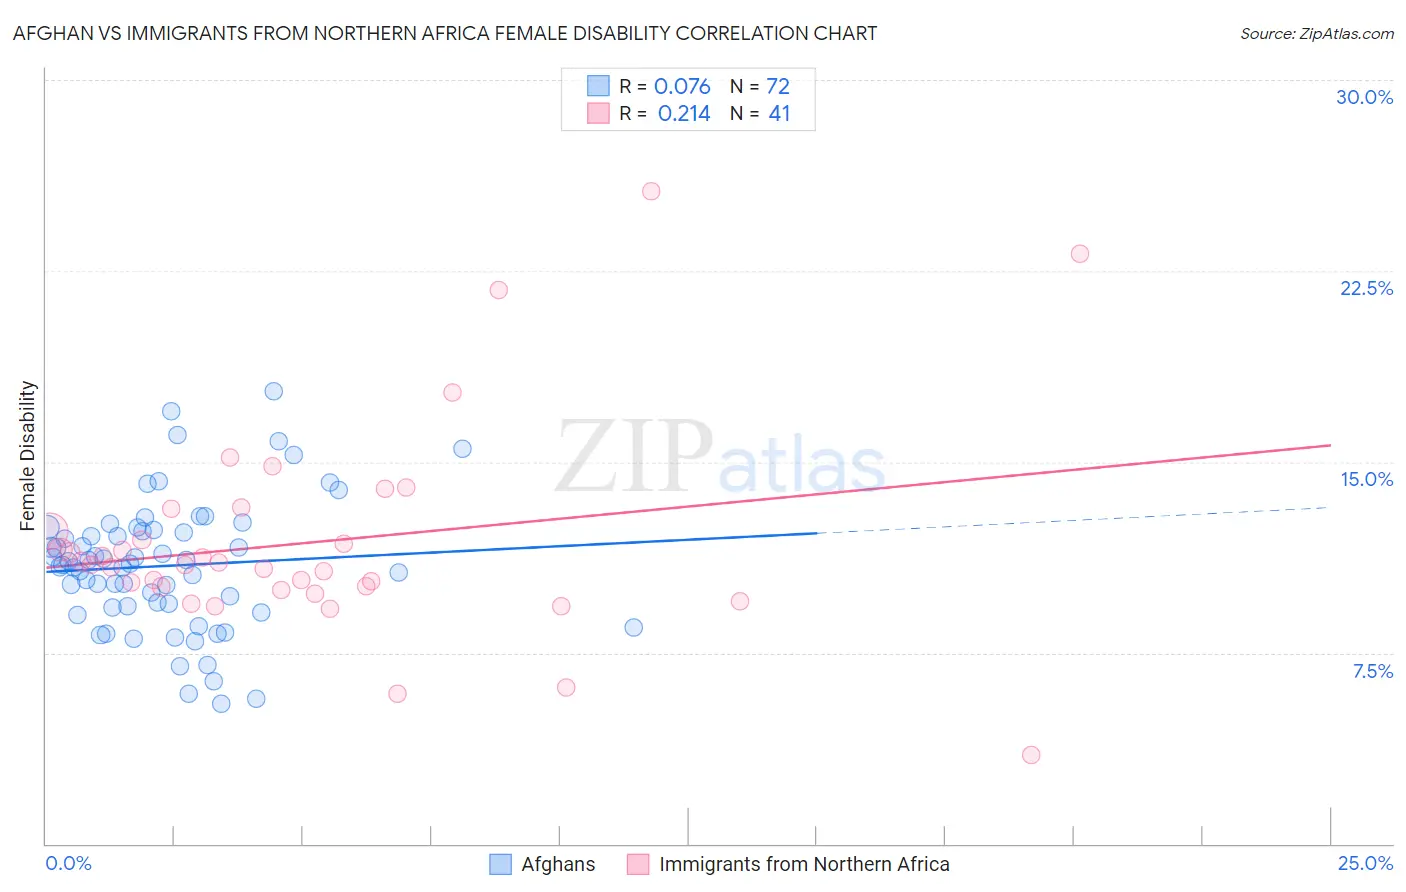
Afghan vs Immigrants from Northern Africa Female Disability Correlation Chart
The statistical analysis conducted on geographies consisting of 148,868,441 people shows a slight positive correlation between the proportion of Afghans and percentage of females with a disability in the United States with a correlation coefficient (R) of 0.076 and weighted average of 11.2%. Similarly, the statistical analysis conducted on geographies consisting of 321,175,054 people shows a weak positive correlation between the proportion of Immigrants from Northern Africa and percentage of females with a disability in the United States with a correlation coefficient (R) of 0.214 and weighted average of 11.5%, a difference of 2.0%.
Female Disability Correlation Summary
| Measurement | Afghan | Immigrants from Northern Africa |
| Minimum | 5.5% | 3.5% |
| Maximum | 17.8% | 25.6% |
| Range | 12.3% | 22.1% |
| Mean | 10.9% | 11.8% |
| Median | 11.0% | 10.9% |
| Interquartile 25% (IQ1) | 9.3% | 10.0% |
| Interquartile 75% (IQ3) | 12.3% | 12.7% |
| Interquartile Range (IQR) | 3.0% | 2.7% |
| Standard Deviation (Sample) | 2.6% | 4.1% |
| Standard Deviation (Population) | 2.6% | 4.1% |
Similar Demographics by Female Disability
Demographics Similar to Afghans by Female Disability
In terms of female disability, the demographic groups most similar to Afghans are Israeli (11.2%, a difference of 0.030%), Paraguayan (11.2%, a difference of 0.12%), Mongolian (11.2%, a difference of 0.14%), Immigrants from Lithuania (11.2%, a difference of 0.17%), and Cambodian (11.3%, a difference of 0.20%).
| Demographics | Rating | Rank | Female Disability |
| Cypriots | 100.0 /100 | #36 | Exceptional 11.2% |
| Ethiopians | 100.0 /100 | #37 | Exceptional 11.2% |
| Immigrants | Ethiopia | 100.0 /100 | #38 | Exceptional 11.2% |
| Immigrants | Lithuania | 100.0 /100 | #39 | Exceptional 11.2% |
| Mongolians | 100.0 /100 | #40 | Exceptional 11.2% |
| Paraguayans | 100.0 /100 | #41 | Exceptional 11.2% |
| Israelis | 100.0 /100 | #42 | Exceptional 11.2% |
| Afghans | 100.0 /100 | #43 | Exceptional 11.2% |
| Cambodians | 100.0 /100 | #44 | Exceptional 11.3% |
| Immigrants | Sweden | 100.0 /100 | #45 | Exceptional 11.3% |
| Immigrants | Nepal | 100.0 /100 | #46 | Exceptional 11.3% |
| Jordanians | 100.0 /100 | #47 | Exceptional 11.3% |
| Zimbabweans | 100.0 /100 | #48 | Exceptional 11.3% |
| Tongans | 100.0 /100 | #49 | Exceptional 11.3% |
| Inupiat | 100.0 /100 | #50 | Exceptional 11.3% |
Demographics Similar to Immigrants from Northern Africa by Female Disability
In terms of female disability, the demographic groups most similar to Immigrants from Northern Africa are Immigrants from Vietnam (11.5%, a difference of 0.020%), Salvadoran (11.5%, a difference of 0.060%), Colombian (11.5%, a difference of 0.070%), Immigrants from Chile (11.5%, a difference of 0.080%), and Immigrants from Ireland (11.5%, a difference of 0.13%).
| Demographics | Rating | Rank | Female Disability |
| Immigrants | France | 99.9 /100 | #61 | Exceptional 11.4% |
| Sri Lankans | 99.9 /100 | #62 | Exceptional 11.4% |
| Immigrants | Colombia | 99.9 /100 | #63 | Exceptional 11.4% |
| Immigrants | El Salvador | 99.9 /100 | #64 | Exceptional 11.4% |
| Immigrants | South America | 99.9 /100 | #65 | Exceptional 11.4% |
| Salvadorans | 99.8 /100 | #66 | Exceptional 11.5% |
| Immigrants | Vietnam | 99.8 /100 | #67 | Exceptional 11.5% |
| Immigrants | Northern Africa | 99.8 /100 | #68 | Exceptional 11.5% |
| Colombians | 99.8 /100 | #69 | Exceptional 11.5% |
| Immigrants | Chile | 99.8 /100 | #70 | Exceptional 11.5% |
| Immigrants | Ireland | 99.8 /100 | #71 | Exceptional 11.5% |
| Chileans | 99.8 /100 | #72 | Exceptional 11.5% |
| Immigrants | Switzerland | 99.8 /100 | #73 | Exceptional 11.5% |
| Bhutanese | 99.8 /100 | #74 | Exceptional 11.5% |
| Immigrants | Lebanon | 99.7 /100 | #75 | Exceptional 11.5% |