Puget Sound Salish vs Immigrants from Northern Africa Doctorate Degree
COMPARE
Puget Sound Salish
Immigrants from Northern Africa
Doctorate Degree
Doctorate Degree Comparison
Puget Sound Salish
Immigrants from Northern Africa
1.2%
DOCTORATE DEGREE
0.0/ 100
METRIC RATING
338th/ 347
METRIC RANK
2.1%
DOCTORATE DEGREE
98.4/ 100
METRIC RATING
96th/ 347
METRIC RANK
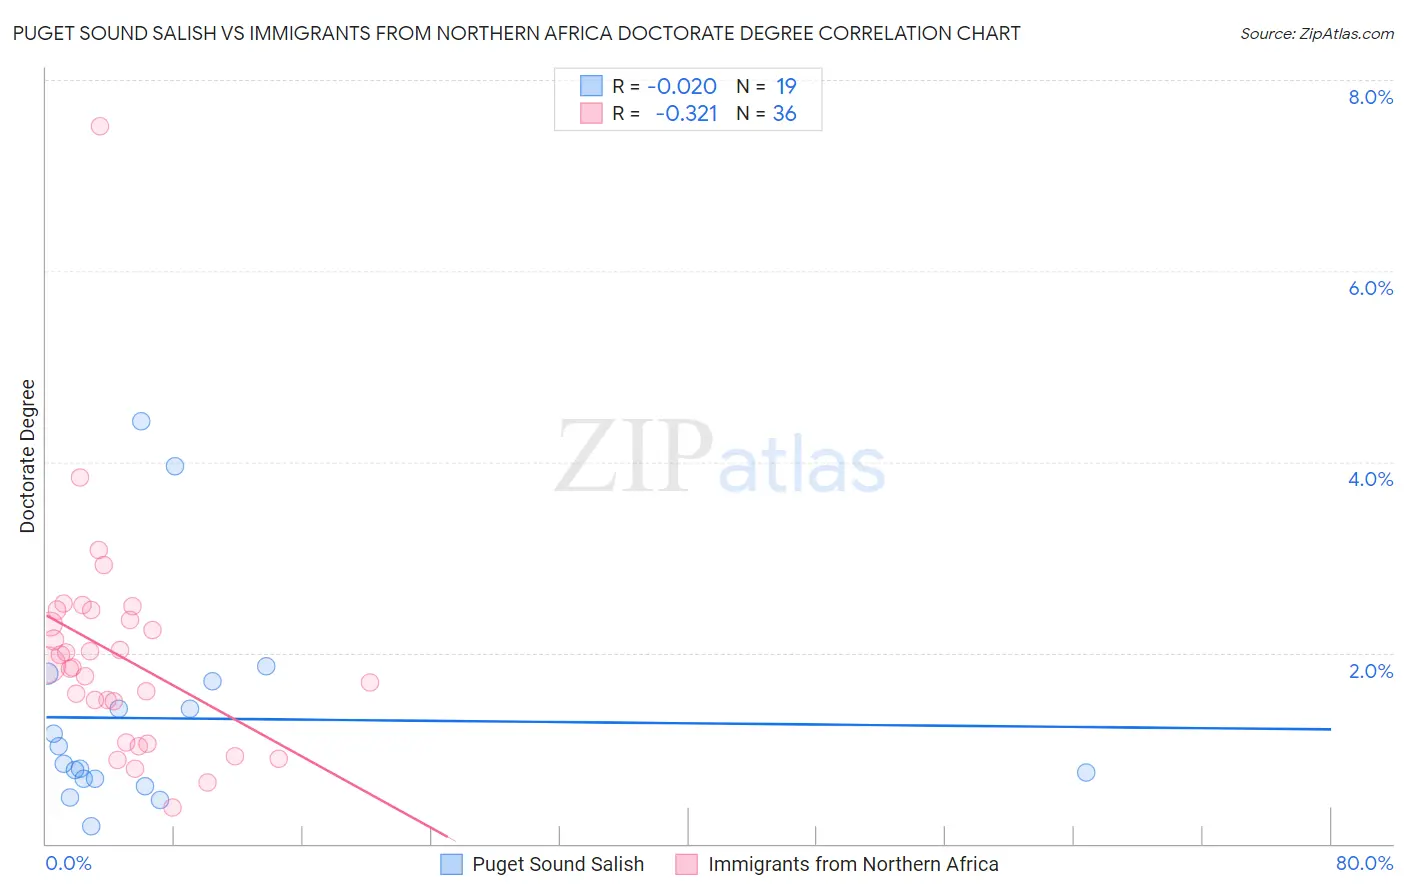
Puget Sound Salish vs Immigrants from Northern Africa Doctorate Degree Correlation Chart
The statistical analysis conducted on geographies consisting of 45,861,164 people shows no correlation between the proportion of Puget Sound Salish and percentage of population with at least doctorate degree education in the United States with a correlation coefficient (R) of -0.020 and weighted average of 1.2%. Similarly, the statistical analysis conducted on geographies consisting of 319,875,205 people shows a mild negative correlation between the proportion of Immigrants from Northern Africa and percentage of population with at least doctorate degree education in the United States with a correlation coefficient (R) of -0.321 and weighted average of 2.1%, a difference of 76.2%.
Doctorate Degree Correlation Summary
| Measurement | Puget Sound Salish | Immigrants from Northern Africa |
| Minimum | 0.19% | 0.38% |
| Maximum | 4.4% | 7.5% |
| Range | 4.2% | 7.1% |
| Mean | 1.3% | 2.0% |
| Median | 0.83% | 1.9% |
| Interquartile 25% (IQ1) | 0.67% | 1.3% |
| Interquartile 75% (IQ3) | 1.7% | 2.4% |
| Interquartile Range (IQR) | 1.0% | 1.1% |
| Standard Deviation (Sample) | 1.1% | 1.2% |
| Standard Deviation (Population) | 1.1% | 1.2% |
Similar Demographics by Doctorate Degree
Demographics Similar to Puget Sound Salish by Doctorate Degree
In terms of doctorate degree, the demographic groups most similar to Puget Sound Salish are Bangladeshi (1.2%, a difference of 0.75%), Immigrants from Central America (1.2%, a difference of 1.3%), Immigrants from Cuba (1.2%, a difference of 2.1%), Mexican (1.2%, a difference of 2.6%), and Arapaho (1.2%, a difference of 3.0%).
| Demographics | Rating | Rank | Doctorate Degree |
| Immigrants | Latin America | 0.0 /100 | #331 | Tragic 1.3% |
| Yakama | 0.0 /100 | #332 | Tragic 1.3% |
| Immigrants | Caribbean | 0.0 /100 | #333 | Tragic 1.3% |
| Immigrants | Dominican Republic | 0.0 /100 | #334 | Tragic 1.3% |
| Immigrants | Haiti | 0.0 /100 | #335 | Tragic 1.3% |
| Nepalese | 0.0 /100 | #336 | Tragic 1.3% |
| Bangladeshis | 0.0 /100 | #337 | Tragic 1.2% |
| Puget Sound Salish | 0.0 /100 | #338 | Tragic 1.2% |
| Immigrants | Central America | 0.0 /100 | #339 | Tragic 1.2% |
| Immigrants | Cuba | 0.0 /100 | #340 | Tragic 1.2% |
| Mexicans | 0.0 /100 | #341 | Tragic 1.2% |
| Arapaho | 0.0 /100 | #342 | Tragic 1.2% |
| Fijians | 0.0 /100 | #343 | Tragic 1.1% |
| Immigrants | Mexico | 0.0 /100 | #344 | Tragic 1.1% |
| Lumbee | 0.0 /100 | #345 | Tragic 1.1% |
Demographics Similar to Immigrants from Northern Africa by Doctorate Degree
In terms of doctorate degree, the demographic groups most similar to Immigrants from Northern Africa are Immigrants from Eritrea (2.1%, a difference of 0.13%), Armenian (2.1%, a difference of 0.21%), Immigrants from Egypt (2.1%, a difference of 0.39%), Immigrants from Eastern Europe (2.1%, a difference of 0.39%), and Immigrants from Eastern Africa (2.1%, a difference of 0.43%).
| Demographics | Rating | Rank | Doctorate Degree |
| British | 99.3 /100 | #89 | Exceptional 2.2% |
| Immigrants | Scotland | 99.2 /100 | #90 | Exceptional 2.2% |
| Immigrants | Sudan | 99.1 /100 | #91 | Exceptional 2.2% |
| Chileans | 99.1 /100 | #92 | Exceptional 2.2% |
| Alsatians | 99.0 /100 | #93 | Exceptional 2.1% |
| Greeks | 98.8 /100 | #94 | Exceptional 2.1% |
| Immigrants | Romania | 98.7 /100 | #95 | Exceptional 2.1% |
| Immigrants | Northern Africa | 98.4 /100 | #96 | Exceptional 2.1% |
| Immigrants | Eritrea | 98.4 /100 | #97 | Exceptional 2.1% |
| Armenians | 98.3 /100 | #98 | Exceptional 2.1% |
| Immigrants | Egypt | 98.2 /100 | #99 | Exceptional 2.1% |
| Immigrants | Eastern Europe | 98.2 /100 | #100 | Exceptional 2.1% |
| Immigrants | Eastern Africa | 98.2 /100 | #101 | Exceptional 2.1% |
| Immigrants | Chile | 98.1 /100 | #102 | Exceptional 2.1% |
| Romanians | 98.1 /100 | #103 | Exceptional 2.1% |