Immigrants from Asia vs Haitian Female Disability
COMPARE
Immigrants from Asia
Haitian
Female Disability
Female Disability Comparison
Immigrants from Asia
Haitians
11.0%
FEMALE DISABILITY
100.0/ 100
METRIC RATING
25th/ 347
METRIC RANK
12.2%
FEMALE DISABILITY
51.9/ 100
METRIC RATING
172nd/ 347
METRIC RANK
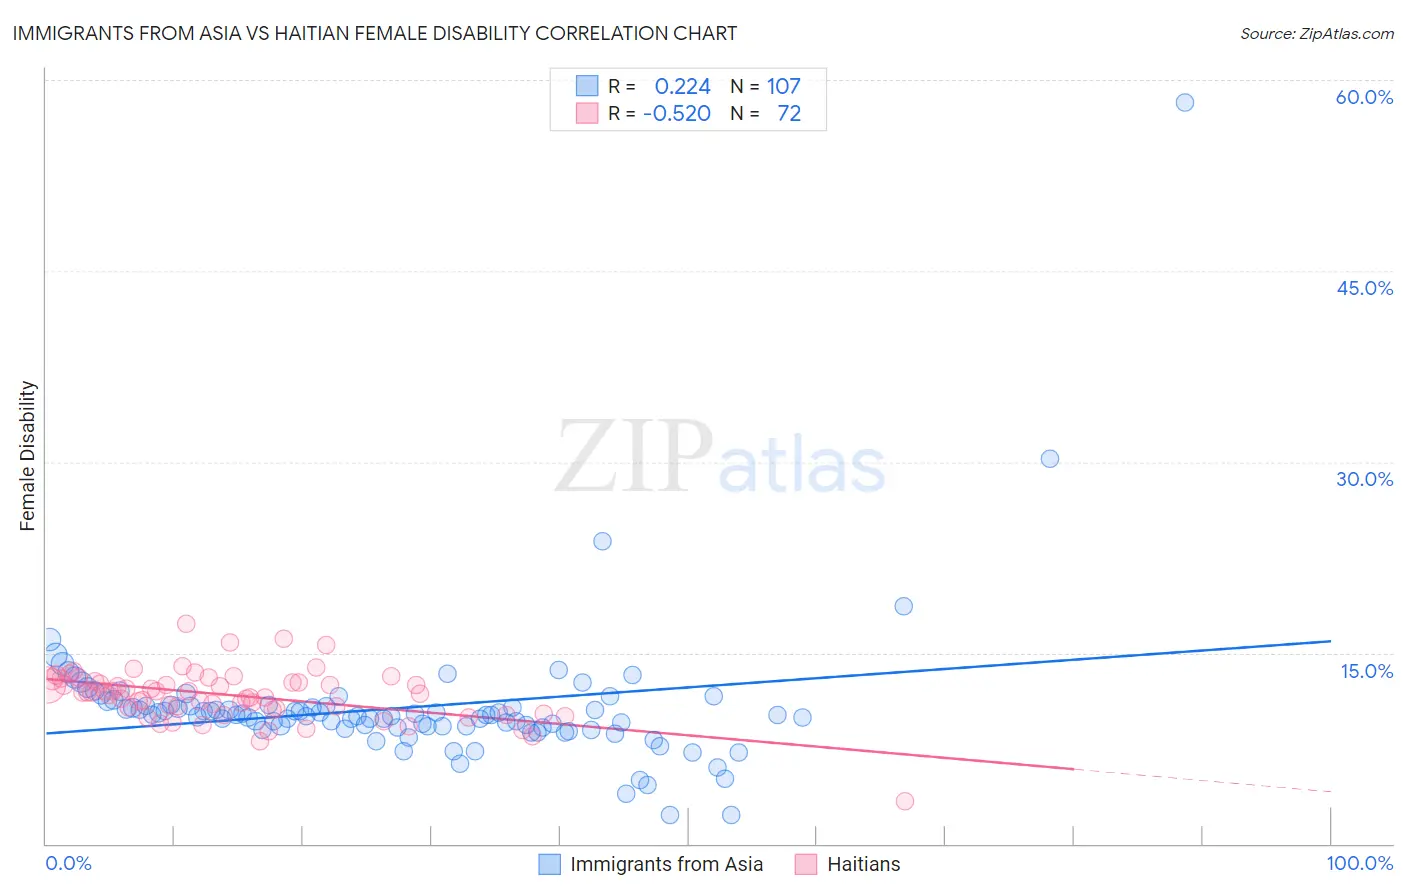
Immigrants from Asia vs Haitian Female Disability Correlation Chart
The statistical analysis conducted on geographies consisting of 548,970,010 people shows a weak positive correlation between the proportion of Immigrants from Asia and percentage of females with a disability in the United States with a correlation coefficient (R) of 0.224 and weighted average of 11.0%. Similarly, the statistical analysis conducted on geographies consisting of 287,924,181 people shows a substantial negative correlation between the proportion of Haitians and percentage of females with a disability in the United States with a correlation coefficient (R) of -0.520 and weighted average of 12.2%, a difference of 10.6%.
Female Disability Correlation Summary
| Measurement | Immigrants from Asia | Haitian |
| Minimum | 2.2% | 3.3% |
| Maximum | 58.2% | 17.2% |
| Range | 56.0% | 13.9% |
| Mean | 10.7% | 11.6% |
| Median | 10.1% | 11.9% |
| Interquartile 25% (IQ1) | 9.2% | 10.5% |
| Interquartile 75% (IQ3) | 10.8% | 12.7% |
| Interquartile Range (IQR) | 1.7% | 2.2% |
| Standard Deviation (Sample) | 5.7% | 2.0% |
| Standard Deviation (Population) | 5.7% | 2.0% |
Similar Demographics by Female Disability
Demographics Similar to Immigrants from Asia by Female Disability
In terms of female disability, the demographic groups most similar to Immigrants from Asia are Immigrants from Argentina (11.0%, a difference of 0.030%), Argentinean (11.0%, a difference of 0.040%), Immigrants from Turkey (11.1%, a difference of 0.44%), Venezuelan (11.0%, a difference of 0.59%), and Egyptian (11.1%, a difference of 0.72%).
| Demographics | Rating | Rank | Female Disability |
| Immigrants | Iran | 100.0 /100 | #18 | Exceptional 10.8% |
| Immigrants | Venezuela | 100.0 /100 | #19 | Exceptional 10.9% |
| Immigrants | Pakistan | 100.0 /100 | #20 | Exceptional 10.9% |
| Asians | 100.0 /100 | #21 | Exceptional 10.9% |
| Immigrants | Sri Lanka | 100.0 /100 | #22 | Exceptional 10.9% |
| Venezuelans | 100.0 /100 | #23 | Exceptional 11.0% |
| Immigrants | Argentina | 100.0 /100 | #24 | Exceptional 11.0% |
| Immigrants | Asia | 100.0 /100 | #25 | Exceptional 11.0% |
| Argentineans | 100.0 /100 | #26 | Exceptional 11.0% |
| Immigrants | Turkey | 100.0 /100 | #27 | Exceptional 11.1% |
| Egyptians | 100.0 /100 | #28 | Exceptional 11.1% |
| Immigrants | Malaysia | 100.0 /100 | #29 | Exceptional 11.1% |
| Turks | 100.0 /100 | #30 | Exceptional 11.1% |
| Immigrants | Kuwait | 100.0 /100 | #31 | Exceptional 11.1% |
| Immigrants | Australia | 100.0 /100 | #32 | Exceptional 11.1% |
Demographics Similar to Haitians by Female Disability
In terms of female disability, the demographic groups most similar to Haitians are Immigrants from Mexico (12.2%, a difference of 0.040%), Immigrants from England (12.2%, a difference of 0.070%), Immigrants from St. Vincent and the Grenadines (12.2%, a difference of 0.080%), Immigrants from Southern Europe (12.2%, a difference of 0.17%), and Maltese (12.2%, a difference of 0.19%).
| Demographics | Rating | Rank | Female Disability |
| Immigrants | Oceania | 61.8 /100 | #165 | Good 12.1% |
| Lithuanians | 59.5 /100 | #166 | Average 12.2% |
| Immigrants | Latin America | 59.0 /100 | #167 | Average 12.2% |
| Immigrants | Haiti | 58.8 /100 | #168 | Average 12.2% |
| Lebanese | 58.1 /100 | #169 | Average 12.2% |
| Maltese | 57.0 /100 | #170 | Average 12.2% |
| Immigrants | Southern Europe | 56.3 /100 | #171 | Average 12.2% |
| Haitians | 51.9 /100 | #172 | Average 12.2% |
| Immigrants | Mexico | 50.8 /100 | #173 | Average 12.2% |
| Immigrants | England | 50.0 /100 | #174 | Average 12.2% |
| Immigrants | St. Vincent and the Grenadines | 49.7 /100 | #175 | Average 12.2% |
| Immigrants | Guyana | 43.1 /100 | #176 | Average 12.2% |
| Immigrants | Ghana | 42.5 /100 | #177 | Average 12.2% |
| Immigrants | Western Europe | 40.9 /100 | #178 | Average 12.2% |
| Immigrants | Fiji | 38.2 /100 | #179 | Fair 12.3% |