Puerto Rican vs Scotch-Irish Hearing Disability
COMPARE
Puerto Rican
Scotch-Irish
Hearing Disability
Hearing Disability Comparison
Puerto Ricans
Scotch-Irish
3.5%
HEARING DISABILITY
0.0/ 100
METRIC RATING
273rd/ 347
METRIC RANK
3.8%
HEARING DISABILITY
0.0/ 100
METRIC RATING
309th/ 347
METRIC RANK
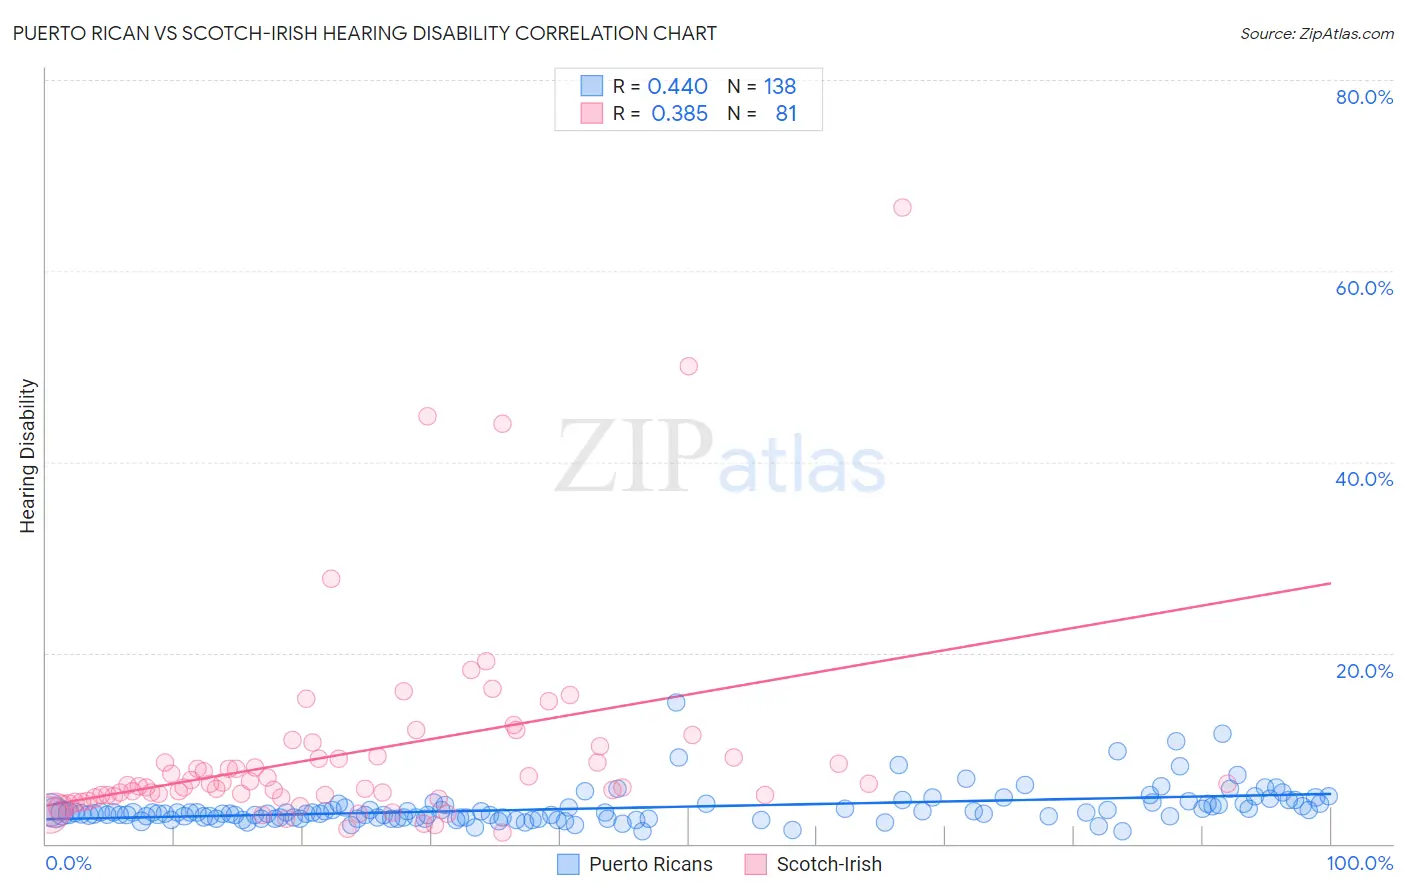
Puerto Rican vs Scotch-Irish Hearing Disability Correlation Chart
The statistical analysis conducted on geographies consisting of 527,769,112 people shows a moderate positive correlation between the proportion of Puerto Ricans and percentage of population with hearing disability in the United States with a correlation coefficient (R) of 0.440 and weighted average of 3.5%. Similarly, the statistical analysis conducted on geographies consisting of 548,308,255 people shows a mild positive correlation between the proportion of Scotch-Irish and percentage of population with hearing disability in the United States with a correlation coefficient (R) of 0.385 and weighted average of 3.8%, a difference of 8.5%.
Hearing Disability Correlation Summary
| Measurement | Puerto Rican | Scotch-Irish |
| Minimum | 1.3% | 1.2% |
| Maximum | 14.8% | 66.7% |
| Range | 13.5% | 65.5% |
| Mean | 3.7% | 9.5% |
| Median | 3.2% | 6.1% |
| Interquartile 25% (IQ1) | 2.7% | 4.9% |
| Interquartile 75% (IQ3) | 4.1% | 9.1% |
| Interquartile Range (IQR) | 1.4% | 4.2% |
| Standard Deviation (Sample) | 1.9% | 10.8% |
| Standard Deviation (Population) | 1.9% | 10.7% |
Similar Demographics by Hearing Disability
Demographics Similar to Puerto Ricans by Hearing Disability
In terms of hearing disability, the demographic groups most similar to Puerto Ricans are Fijian (3.5%, a difference of 0.070%), Swiss (3.5%, a difference of 0.32%), Czech (3.5%, a difference of 0.33%), Czechoslovakian (3.6%, a difference of 0.53%), and European (3.5%, a difference of 0.59%).
| Demographics | Rating | Rank | Hearing Disability |
| Belgians | 0.1 /100 | #266 | Tragic 3.5% |
| Canadians | 0.1 /100 | #267 | Tragic 3.5% |
| Spaniards | 0.1 /100 | #268 | Tragic 3.5% |
| Ute | 0.1 /100 | #269 | Tragic 3.5% |
| Europeans | 0.1 /100 | #270 | Tragic 3.5% |
| Czechs | 0.1 /100 | #271 | Tragic 3.5% |
| Fijians | 0.0 /100 | #272 | Tragic 3.5% |
| Puerto Ricans | 0.0 /100 | #273 | Tragic 3.5% |
| Swiss | 0.0 /100 | #274 | Tragic 3.5% |
| Czechoslovakians | 0.0 /100 | #275 | Tragic 3.6% |
| Danes | 0.0 /100 | #276 | Tragic 3.6% |
| Immigrants | Nonimmigrants | 0.0 /100 | #277 | Tragic 3.6% |
| Basques | 0.0 /100 | #278 | Tragic 3.6% |
| Slovaks | 0.0 /100 | #279 | Tragic 3.6% |
| French American Indians | 0.0 /100 | #280 | Tragic 3.6% |
Demographics Similar to Scotch-Irish by Hearing Disability
In terms of hearing disability, the demographic groups most similar to Scotch-Irish are Ottawa (3.8%, a difference of 0.080%), Cree (3.8%, a difference of 0.31%), French Canadian (3.8%, a difference of 0.52%), Marshallese (3.8%, a difference of 0.64%), and English (3.8%, a difference of 1.5%).
| Demographics | Rating | Rank | Hearing Disability |
| Dutch | 0.0 /100 | #302 | Tragic 3.7% |
| Menominee | 0.0 /100 | #303 | Tragic 3.7% |
| French | 0.0 /100 | #304 | Tragic 3.8% |
| English | 0.0 /100 | #305 | Tragic 3.8% |
| Marshallese | 0.0 /100 | #306 | Tragic 3.8% |
| French Canadians | 0.0 /100 | #307 | Tragic 3.8% |
| Ottawa | 0.0 /100 | #308 | Tragic 3.8% |
| Scotch-Irish | 0.0 /100 | #309 | Tragic 3.8% |
| Cree | 0.0 /100 | #310 | Tragic 3.8% |
| Americans | 0.0 /100 | #311 | Tragic 3.9% |
| Cajuns | 0.0 /100 | #312 | Tragic 3.9% |
| Hopi | 0.0 /100 | #313 | Tragic 3.9% |
| Yakama | 0.0 /100 | #314 | Tragic 3.9% |
| Puget Sound Salish | 0.0 /100 | #315 | Tragic 3.9% |
| Spanish Americans | 0.0 /100 | #316 | Tragic 4.0% |