Puerto Rican vs Immigrants from Senegal Disability Age Over 75
COMPARE
Puerto Rican
Immigrants from Senegal
Disability Age Over 75
Disability Age Over 75 Comparison
Puerto Ricans
Immigrants from Senegal
52.9%
DISABILITY AGE OVER 75
0.0/ 100
METRIC RATING
330th/ 347
METRIC RANK
47.8%
DISABILITY AGE OVER 75
16.9/ 100
METRIC RATING
208th/ 347
METRIC RANK
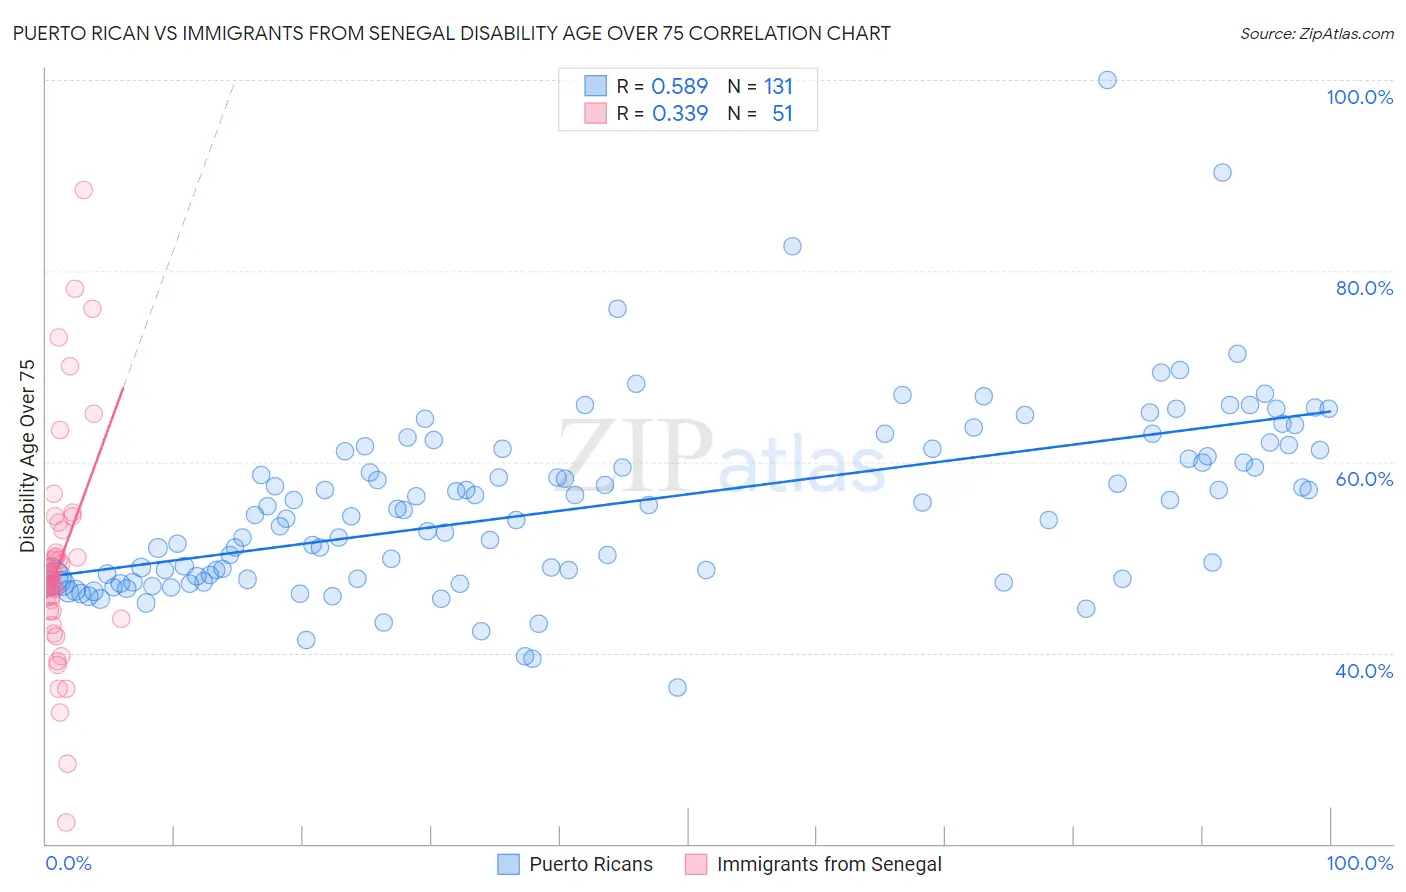
Puerto Rican vs Immigrants from Senegal Disability Age Over 75 Correlation Chart
The statistical analysis conducted on geographies consisting of 526,593,601 people shows a substantial positive correlation between the proportion of Puerto Ricans and percentage of population with a disability over the age of 75 in the United States with a correlation coefficient (R) of 0.589 and weighted average of 52.9%. Similarly, the statistical analysis conducted on geographies consisting of 90,077,022 people shows a mild positive correlation between the proportion of Immigrants from Senegal and percentage of population with a disability over the age of 75 in the United States with a correlation coefficient (R) of 0.339 and weighted average of 47.8%, a difference of 10.7%.
Disability Age Over 75 Correlation Summary
| Measurement | Puerto Rican | Immigrants from Senegal |
| Minimum | 36.4% | 22.2% |
| Maximum | 100.0% | 88.5% |
| Range | 63.6% | 66.3% |
| Mean | 55.4% | 49.6% |
| Median | 54.9% | 47.8% |
| Interquartile 25% (IQ1) | 47.8% | 44.3% |
| Interquartile 75% (IQ3) | 61.4% | 52.9% |
| Interquartile Range (IQR) | 13.6% | 8.6% |
| Standard Deviation (Sample) | 9.6% | 11.9% |
| Standard Deviation (Population) | 9.5% | 11.8% |
Similar Demographics by Disability Age Over 75
Demographics Similar to Puerto Ricans by Disability Age Over 75
In terms of disability age over 75, the demographic groups most similar to Puerto Ricans are Hopi (52.9%, a difference of 0.020%), Alaska Native (52.8%, a difference of 0.18%), Native/Alaskan (53.1%, a difference of 0.31%), Choctaw (52.7%, a difference of 0.39%), and Nepalese (52.6%, a difference of 0.58%).
| Demographics | Rating | Rank | Disability Age Over 75 |
| Immigrants | Yemen | 0.0 /100 | #323 | Tragic 52.0% |
| Menominee | 0.0 /100 | #324 | Tragic 52.3% |
| Immigrants | Cabo Verde | 0.0 /100 | #325 | Tragic 52.4% |
| Ute | 0.0 /100 | #326 | Tragic 52.6% |
| Nepalese | 0.0 /100 | #327 | Tragic 52.6% |
| Choctaw | 0.0 /100 | #328 | Tragic 52.7% |
| Alaska Natives | 0.0 /100 | #329 | Tragic 52.8% |
| Puerto Ricans | 0.0 /100 | #330 | Tragic 52.9% |
| Hopi | 0.0 /100 | #331 | Tragic 52.9% |
| Natives/Alaskans | 0.0 /100 | #332 | Tragic 53.1% |
| Apache | 0.0 /100 | #333 | Tragic 53.6% |
| Alaskan Athabascans | 0.0 /100 | #334 | Tragic 54.0% |
| Kiowa | 0.0 /100 | #335 | Tragic 54.2% |
| Immigrants | Armenia | 0.0 /100 | #336 | Tragic 54.3% |
| Yuman | 0.0 /100 | #337 | Tragic 54.4% |
Demographics Similar to Immigrants from Senegal by Disability Age Over 75
In terms of disability age over 75, the demographic groups most similar to Immigrants from Senegal are Immigrants from Syria (47.8%, a difference of 0.020%), Immigrants from Ghana (47.7%, a difference of 0.080%), Jamaican (47.7%, a difference of 0.080%), Nigerian (47.7%, a difference of 0.090%), and Immigrants from Indonesia (47.8%, a difference of 0.11%).
| Demographics | Rating | Rank | Disability Age Over 75 |
| Immigrants | Cuba | 20.9 /100 | #201 | Fair 47.7% |
| Immigrants | Bahamas | 20.7 /100 | #202 | Fair 47.7% |
| Trinidadians and Tobagonians | 20.0 /100 | #203 | Fair 47.7% |
| Nigerians | 19.2 /100 | #204 | Poor 47.7% |
| Immigrants | Ghana | 19.1 /100 | #205 | Poor 47.7% |
| Jamaicans | 19.0 /100 | #206 | Poor 47.7% |
| Immigrants | Syria | 17.4 /100 | #207 | Poor 47.8% |
| Immigrants | Senegal | 16.9 /100 | #208 | Poor 47.8% |
| Immigrants | Indonesia | 14.2 /100 | #209 | Poor 47.8% |
| Vietnamese | 11.9 /100 | #210 | Poor 47.9% |
| Panamanians | 11.8 /100 | #211 | Poor 47.9% |
| Immigrants | Burma/Myanmar | 11.7 /100 | #212 | Poor 47.9% |
| Laotians | 11.5 /100 | #213 | Poor 47.9% |
| Immigrants | Barbados | 10.7 /100 | #214 | Poor 47.9% |
| Senegalese | 10.7 /100 | #215 | Poor 47.9% |