Pueblo vs Irish Hearing Disability
COMPARE
Pueblo
Irish
Hearing Disability
Hearing Disability Comparison
Pueblo
Irish
4.6%
HEARING DISABILITY
0.0/ 100
METRIC RATING
340th/ 347
METRIC RANK
3.7%
HEARING DISABILITY
0.0/ 100
METRIC RATING
288th/ 347
METRIC RANK
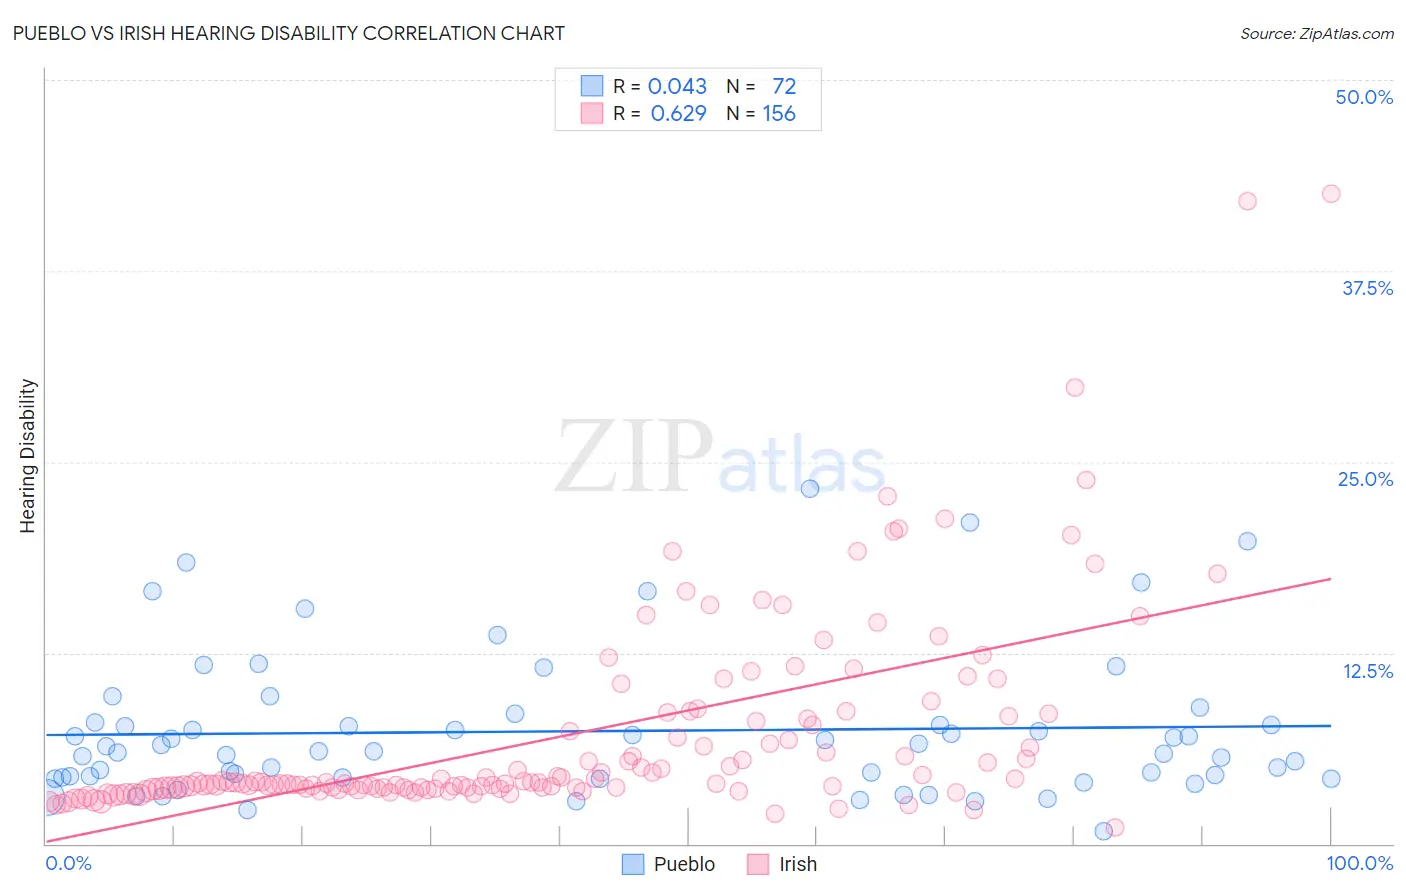
Pueblo vs Irish Hearing Disability Correlation Chart
The statistical analysis conducted on geographies consisting of 120,073,989 people shows no correlation between the proportion of Pueblo and percentage of population with hearing disability in the United States with a correlation coefficient (R) of 0.043 and weighted average of 4.6%. Similarly, the statistical analysis conducted on geographies consisting of 579,581,803 people shows a significant positive correlation between the proportion of Irish and percentage of population with hearing disability in the United States with a correlation coefficient (R) of 0.629 and weighted average of 3.7%, a difference of 25.8%.
Hearing Disability Correlation Summary
| Measurement | Pueblo | Irish |
| Minimum | 0.85% | 1.1% |
| Maximum | 23.2% | 42.5% |
| Range | 22.4% | 41.5% |
| Mean | 7.4% | 7.0% |
| Median | 6.0% | 4.0% |
| Interquartile 25% (IQ1) | 4.3% | 3.6% |
| Interquartile 75% (IQ3) | 7.8% | 8.1% |
| Interquartile Range (IQR) | 3.5% | 4.5% |
| Standard Deviation (Sample) | 4.7% | 6.6% |
| Standard Deviation (Population) | 4.7% | 6.6% |
Similar Demographics by Hearing Disability
Demographics Similar to Pueblo by Hearing Disability
In terms of hearing disability, the demographic groups most similar to Pueblo are Navajo (4.6%, a difference of 0.33%), Choctaw (4.5%, a difference of 1.5%), Tsimshian (4.7%, a difference of 1.9%), Inupiat (4.7%, a difference of 2.1%), and Alaska Native (4.5%, a difference of 2.9%).
| Demographics | Rating | Rank | Hearing Disability |
| Dutch West Indians | 0.0 /100 | #333 | Tragic 4.3% |
| Aleuts | 0.0 /100 | #334 | Tragic 4.3% |
| Kiowa | 0.0 /100 | #335 | Tragic 4.3% |
| Creek | 0.0 /100 | #336 | Tragic 4.4% |
| Chickasaw | 0.0 /100 | #337 | Tragic 4.5% |
| Alaska Natives | 0.0 /100 | #338 | Tragic 4.5% |
| Choctaw | 0.0 /100 | #339 | Tragic 4.5% |
| Pueblo | 0.0 /100 | #340 | Tragic 4.6% |
| Navajo | 0.0 /100 | #341 | Tragic 4.6% |
| Tsimshian | 0.0 /100 | #342 | Tragic 4.7% |
| Inupiat | 0.0 /100 | #343 | Tragic 4.7% |
| Tlingit-Haida | 0.0 /100 | #344 | Tragic 4.8% |
| Alaskan Athabascans | 0.0 /100 | #345 | Tragic 5.3% |
| Colville | 0.0 /100 | #346 | Tragic 5.3% |
| Yup'ik | 0.0 /100 | #347 | Tragic 5.8% |
Demographics Similar to Irish by Hearing Disability
In terms of hearing disability, the demographic groups most similar to Irish are Chinese (3.7%, a difference of 0.21%), White/Caucasian (3.7%, a difference of 0.34%), Finnish (3.7%, a difference of 0.35%), Native Hawaiian (3.7%, a difference of 0.42%), and Norwegian (3.7%, a difference of 0.48%).
| Demographics | Rating | Rank | Hearing Disability |
| Scandinavians | 0.0 /100 | #281 | Tragic 3.6% |
| Swedes | 0.0 /100 | #282 | Tragic 3.6% |
| Blackfeet | 0.0 /100 | #283 | Tragic 3.6% |
| Immigrants | Micronesia | 0.0 /100 | #284 | Tragic 3.6% |
| Sioux | 0.0 /100 | #285 | Tragic 3.6% |
| Delaware | 0.0 /100 | #286 | Tragic 3.6% |
| Spanish | 0.0 /100 | #287 | Tragic 3.7% |
| Irish | 0.0 /100 | #288 | Tragic 3.7% |
| Chinese | 0.0 /100 | #289 | Tragic 3.7% |
| Whites/Caucasians | 0.0 /100 | #290 | Tragic 3.7% |
| Finns | 0.0 /100 | #291 | Tragic 3.7% |
| Native Hawaiians | 0.0 /100 | #292 | Tragic 3.7% |
| Norwegians | 0.0 /100 | #293 | Tragic 3.7% |
| Iroquois | 0.0 /100 | #294 | Tragic 3.7% |
| Welsh | 0.0 /100 | #295 | Tragic 3.7% |