Pueblo vs Immigrants from Cuba Hearing Disability
COMPARE
Pueblo
Immigrants from Cuba
Hearing Disability
Hearing Disability Comparison
Pueblo
Immigrants from Cuba
4.6%
HEARING DISABILITY
0.0/ 100
METRIC RATING
340th/ 347
METRIC RANK
2.7%
HEARING DISABILITY
97.2/ 100
METRIC RATING
83rd/ 347
METRIC RANK
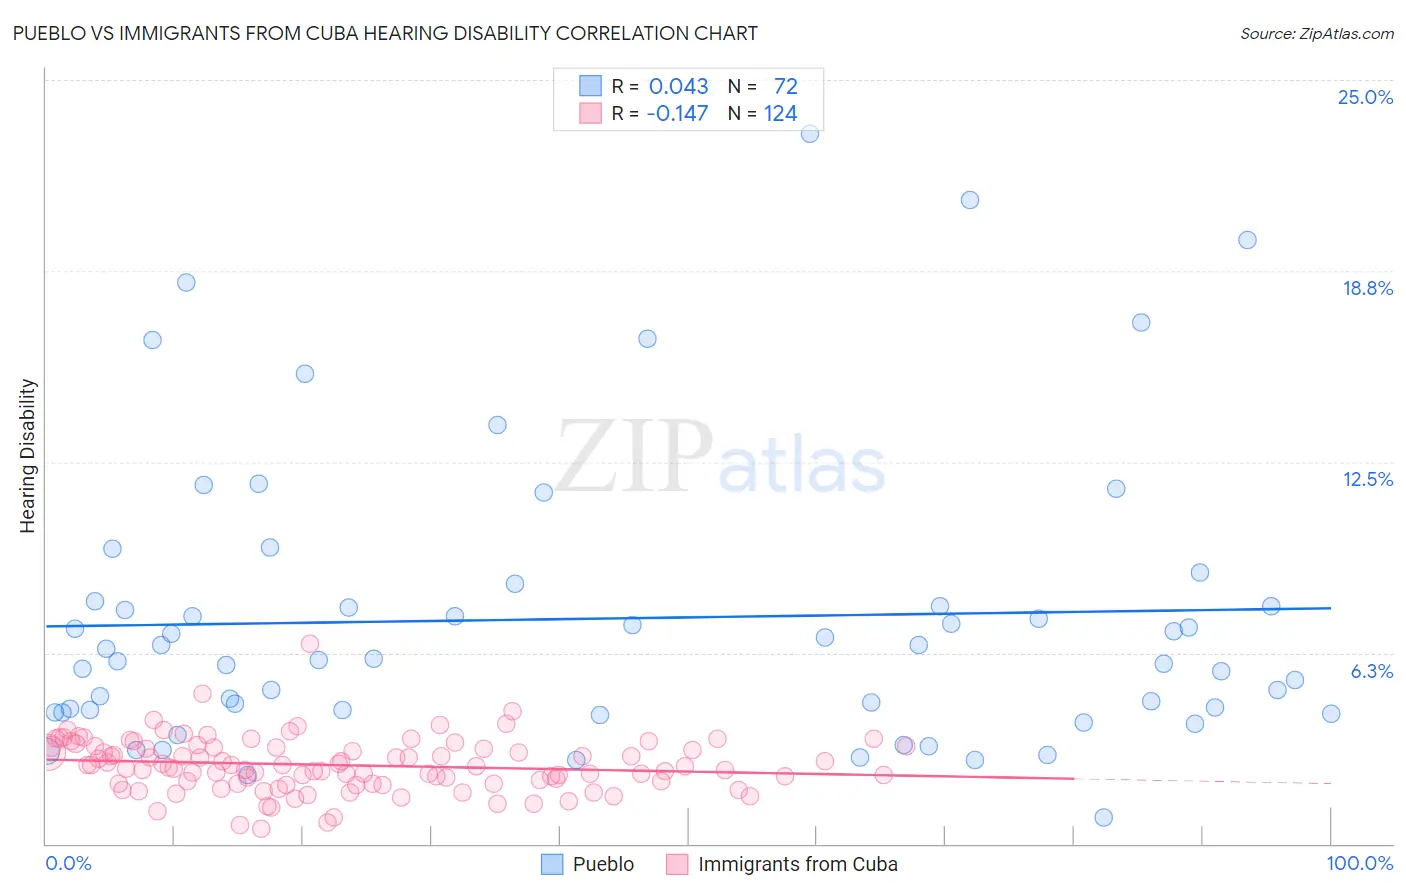
Pueblo vs Immigrants from Cuba Hearing Disability Correlation Chart
The statistical analysis conducted on geographies consisting of 120,073,989 people shows no correlation between the proportion of Pueblo and percentage of population with hearing disability in the United States with a correlation coefficient (R) of 0.043 and weighted average of 4.6%. Similarly, the statistical analysis conducted on geographies consisting of 325,940,819 people shows a poor negative correlation between the proportion of Immigrants from Cuba and percentage of population with hearing disability in the United States with a correlation coefficient (R) of -0.147 and weighted average of 2.7%, a difference of 68.1%.
Hearing Disability Correlation Summary
| Measurement | Pueblo | Immigrants from Cuba |
| Minimum | 0.85% | 0.47% |
| Maximum | 23.2% | 6.5% |
| Range | 22.4% | 6.1% |
| Mean | 7.4% | 2.6% |
| Median | 6.0% | 2.5% |
| Interquartile 25% (IQ1) | 4.3% | 2.0% |
| Interquartile 75% (IQ3) | 7.8% | 3.2% |
| Interquartile Range (IQR) | 3.5% | 1.2% |
| Standard Deviation (Sample) | 4.7% | 0.88% |
| Standard Deviation (Population) | 4.7% | 0.88% |
Similar Demographics by Hearing Disability
Demographics Similar to Pueblo by Hearing Disability
In terms of hearing disability, the demographic groups most similar to Pueblo are Navajo (4.6%, a difference of 0.33%), Choctaw (4.5%, a difference of 1.5%), Tsimshian (4.7%, a difference of 1.9%), Inupiat (4.7%, a difference of 2.1%), and Alaska Native (4.5%, a difference of 2.9%).
| Demographics | Rating | Rank | Hearing Disability |
| Dutch West Indians | 0.0 /100 | #333 | Tragic 4.3% |
| Aleuts | 0.0 /100 | #334 | Tragic 4.3% |
| Kiowa | 0.0 /100 | #335 | Tragic 4.3% |
| Creek | 0.0 /100 | #336 | Tragic 4.4% |
| Chickasaw | 0.0 /100 | #337 | Tragic 4.5% |
| Alaska Natives | 0.0 /100 | #338 | Tragic 4.5% |
| Choctaw | 0.0 /100 | #339 | Tragic 4.5% |
| Pueblo | 0.0 /100 | #340 | Tragic 4.6% |
| Navajo | 0.0 /100 | #341 | Tragic 4.6% |
| Tsimshian | 0.0 /100 | #342 | Tragic 4.7% |
| Inupiat | 0.0 /100 | #343 | Tragic 4.7% |
| Tlingit-Haida | 0.0 /100 | #344 | Tragic 4.8% |
| Alaskan Athabascans | 0.0 /100 | #345 | Tragic 5.3% |
| Colville | 0.0 /100 | #346 | Tragic 5.3% |
| Yup'ik | 0.0 /100 | #347 | Tragic 5.8% |
Demographics Similar to Immigrants from Cuba by Hearing Disability
In terms of hearing disability, the demographic groups most similar to Immigrants from Cuba are Immigrants from Armenia (2.7%, a difference of 0.020%), Immigrants from Uruguay (2.7%, a difference of 0.030%), Immigrants from Asia (2.7%, a difference of 0.060%), Immigrants from Argentina (2.8%, a difference of 0.19%), and Colombian (2.7%, a difference of 0.25%).
| Demographics | Rating | Rank | Hearing Disability |
| Asians | 97.5 /100 | #76 | Exceptional 2.7% |
| Immigrants | Malaysia | 97.5 /100 | #77 | Exceptional 2.7% |
| Mongolians | 97.4 /100 | #78 | Exceptional 2.7% |
| Colombians | 97.4 /100 | #79 | Exceptional 2.7% |
| Immigrants | Asia | 97.2 /100 | #80 | Exceptional 2.7% |
| Immigrants | Uruguay | 97.2 /100 | #81 | Exceptional 2.7% |
| Immigrants | Armenia | 97.2 /100 | #82 | Exceptional 2.7% |
| Immigrants | Cuba | 97.2 /100 | #83 | Exceptional 2.7% |
| Immigrants | Argentina | 97.0 /100 | #84 | Exceptional 2.8% |
| Immigrants | Northern Africa | 96.9 /100 | #85 | Exceptional 2.8% |
| Immigrants | Iran | 96.8 /100 | #86 | Exceptional 2.8% |
| Somalis | 96.7 /100 | #87 | Exceptional 2.8% |
| Immigrants | Turkey | 96.7 /100 | #88 | Exceptional 2.8% |
| Belizeans | 96.6 /100 | #89 | Exceptional 2.8% |
| Immigrants | Morocco | 96.6 /100 | #90 | Exceptional 2.8% |