Immigrants from Vietnam vs Irish Hearing Disability
COMPARE
Immigrants from Vietnam
Irish
Hearing Disability
Hearing Disability Comparison
Immigrants from Vietnam
Irish
2.9%
HEARING DISABILITY
86.5/ 100
METRIC RATING
130th/ 347
METRIC RANK
3.7%
HEARING DISABILITY
0.0/ 100
METRIC RATING
288th/ 347
METRIC RANK
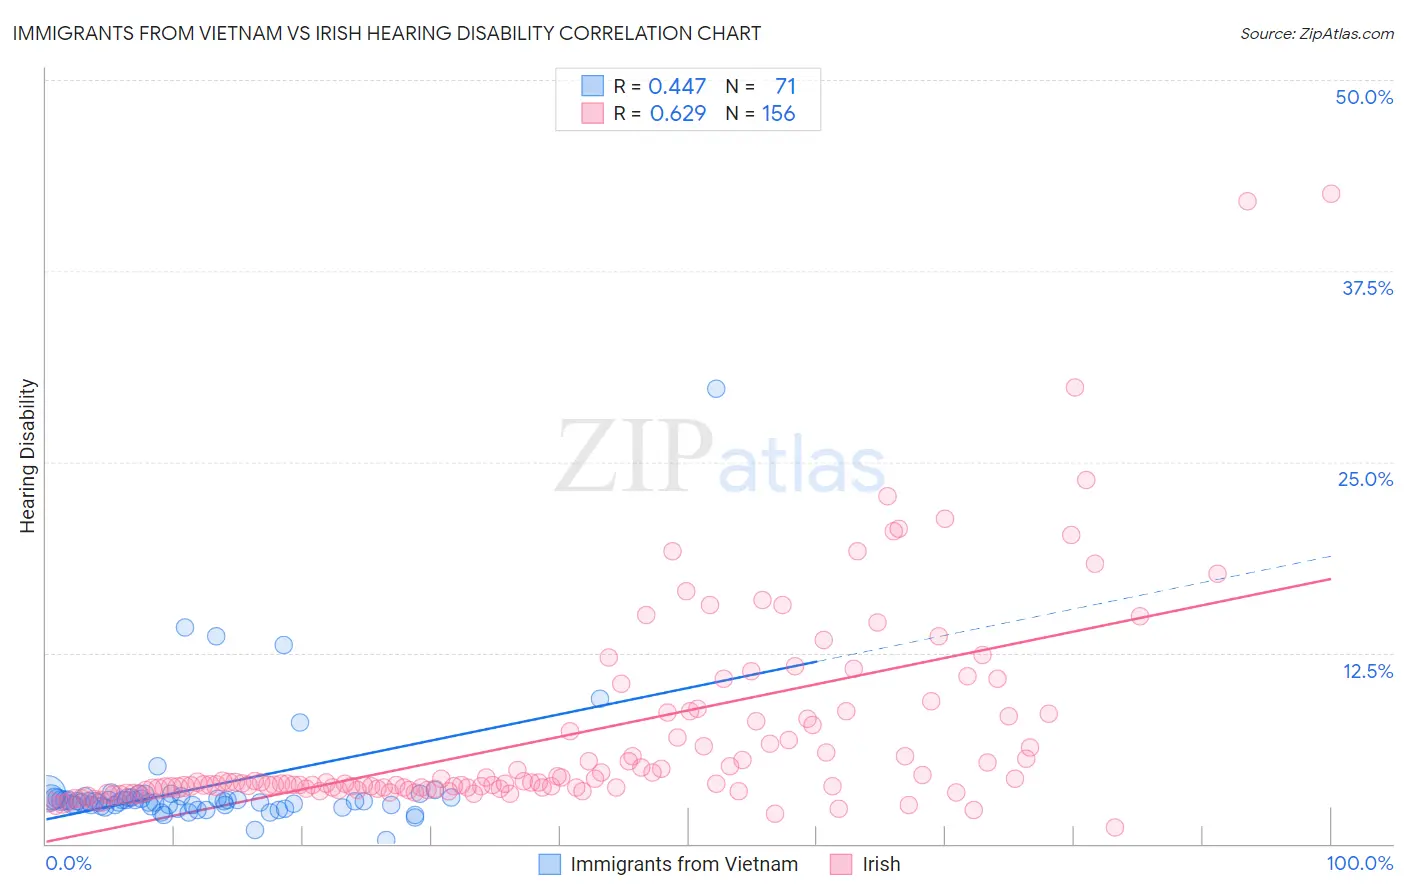
Immigrants from Vietnam vs Irish Hearing Disability Correlation Chart
The statistical analysis conducted on geographies consisting of 404,662,958 people shows a moderate positive correlation between the proportion of Immigrants from Vietnam and percentage of population with hearing disability in the United States with a correlation coefficient (R) of 0.447 and weighted average of 2.9%. Similarly, the statistical analysis conducted on geographies consisting of 579,581,803 people shows a significant positive correlation between the proportion of Irish and percentage of population with hearing disability in the United States with a correlation coefficient (R) of 0.629 and weighted average of 3.7%, a difference of 28.2%.
Hearing Disability Correlation Summary
| Measurement | Immigrants from Vietnam | Irish |
| Minimum | 0.23% | 1.1% |
| Maximum | 29.8% | 42.5% |
| Range | 29.6% | 41.5% |
| Mean | 3.7% | 7.0% |
| Median | 2.8% | 4.0% |
| Interquartile 25% (IQ1) | 2.5% | 3.6% |
| Interquartile 75% (IQ3) | 3.0% | 8.1% |
| Interquartile Range (IQR) | 0.53% | 4.5% |
| Standard Deviation (Sample) | 4.0% | 6.6% |
| Standard Deviation (Population) | 4.0% | 6.6% |
Similar Demographics by Hearing Disability
Demographics Similar to Immigrants from Vietnam by Hearing Disability
In terms of hearing disability, the demographic groups most similar to Immigrants from Vietnam are Immigrants from Uganda (2.9%, a difference of 0.020%), South American Indian (2.9%, a difference of 0.070%), Immigrants from Western Asia (2.9%, a difference of 0.070%), Immigrants from Kenya (2.9%, a difference of 0.090%), and Chilean (2.9%, a difference of 0.14%).
| Demographics | Rating | Rank | Hearing Disability |
| Immigrants | Zaire | 88.6 /100 | #123 | Excellent 2.9% |
| Bahamians | 88.6 /100 | #124 | Excellent 2.9% |
| Immigrants | Albania | 88.5 /100 | #125 | Excellent 2.9% |
| Immigrants | Sudan | 87.8 /100 | #126 | Excellent 2.9% |
| South American Indians | 86.9 /100 | #127 | Excellent 2.9% |
| Immigrants | Western Asia | 86.9 /100 | #128 | Excellent 2.9% |
| Immigrants | Uganda | 86.6 /100 | #129 | Excellent 2.9% |
| Immigrants | Vietnam | 86.5 /100 | #130 | Excellent 2.9% |
| Immigrants | Kenya | 86.1 /100 | #131 | Excellent 2.9% |
| Chileans | 85.8 /100 | #132 | Excellent 2.9% |
| Immigrants | Syria | 85.8 /100 | #133 | Excellent 2.9% |
| Ugandans | 85.5 /100 | #134 | Excellent 2.9% |
| Soviet Union | 84.8 /100 | #135 | Excellent 2.9% |
| Immigrants | Brazil | 84.6 /100 | #136 | Excellent 2.9% |
| Sri Lankans | 84.1 /100 | #137 | Excellent 2.9% |
Demographics Similar to Irish by Hearing Disability
In terms of hearing disability, the demographic groups most similar to Irish are Chinese (3.7%, a difference of 0.21%), White/Caucasian (3.7%, a difference of 0.34%), Finnish (3.7%, a difference of 0.35%), Native Hawaiian (3.7%, a difference of 0.42%), and Norwegian (3.7%, a difference of 0.48%).
| Demographics | Rating | Rank | Hearing Disability |
| Scandinavians | 0.0 /100 | #281 | Tragic 3.6% |
| Swedes | 0.0 /100 | #282 | Tragic 3.6% |
| Blackfeet | 0.0 /100 | #283 | Tragic 3.6% |
| Immigrants | Micronesia | 0.0 /100 | #284 | Tragic 3.6% |
| Sioux | 0.0 /100 | #285 | Tragic 3.6% |
| Delaware | 0.0 /100 | #286 | Tragic 3.6% |
| Spanish | 0.0 /100 | #287 | Tragic 3.7% |
| Irish | 0.0 /100 | #288 | Tragic 3.7% |
| Chinese | 0.0 /100 | #289 | Tragic 3.7% |
| Whites/Caucasians | 0.0 /100 | #290 | Tragic 3.7% |
| Finns | 0.0 /100 | #291 | Tragic 3.7% |
| Native Hawaiians | 0.0 /100 | #292 | Tragic 3.7% |
| Norwegians | 0.0 /100 | #293 | Tragic 3.7% |
| Iroquois | 0.0 /100 | #294 | Tragic 3.7% |
| Welsh | 0.0 /100 | #295 | Tragic 3.7% |