Pueblo vs Immigrants from Philippines Cognitive Disability
COMPARE
Pueblo
Immigrants from Philippines
Cognitive Disability
Cognitive Disability Comparison
Pueblo
Immigrants from Philippines
18.7%
COGNITIVE DISABILITY
0.0/ 100
METRIC RATING
323rd/ 347
METRIC RANK
16.7%
COGNITIVE DISABILITY
99.0/ 100
METRIC RATING
88th/ 347
METRIC RANK
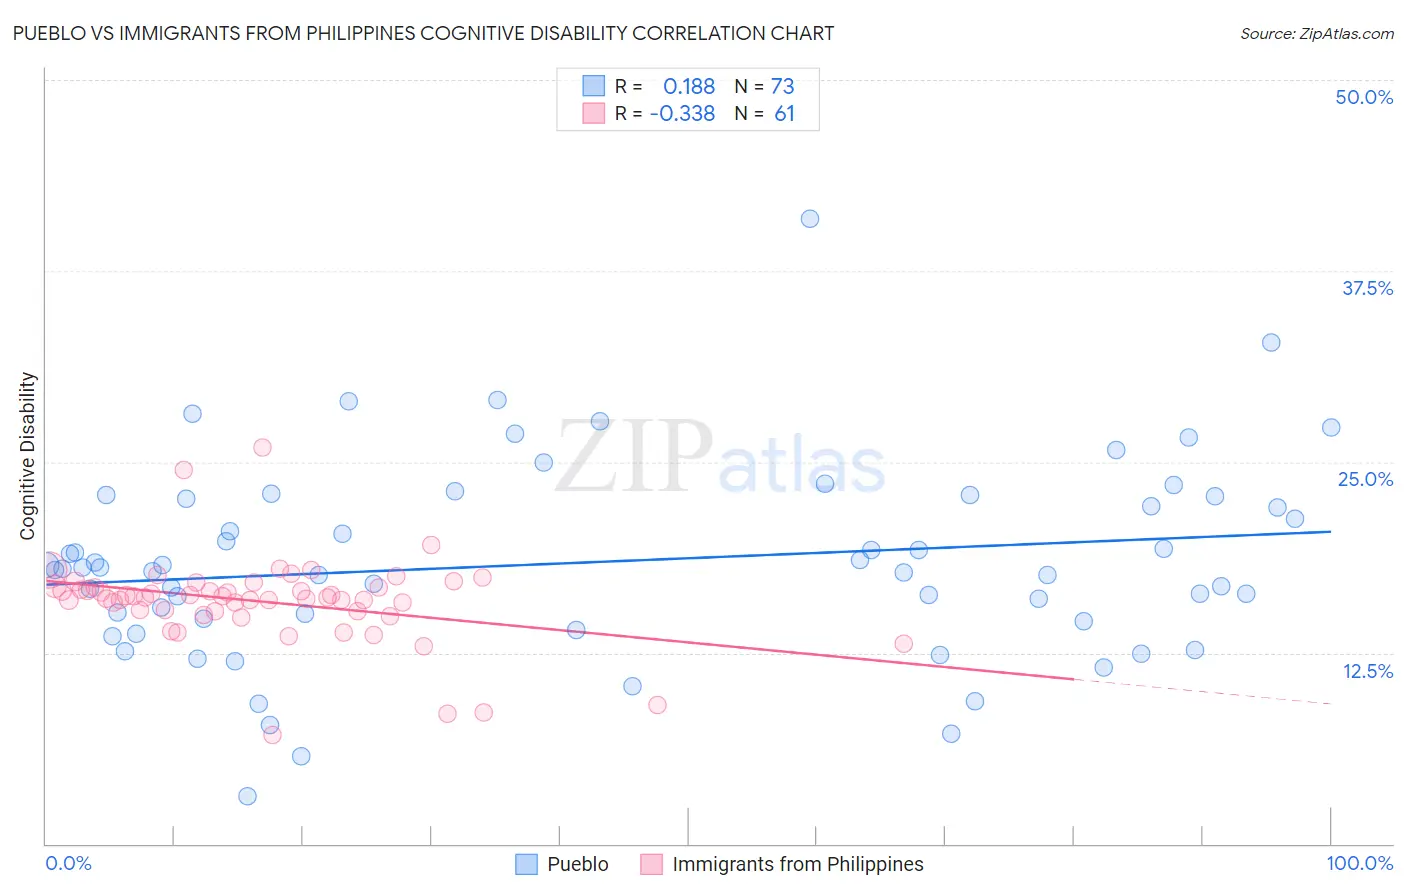
Pueblo vs Immigrants from Philippines Cognitive Disability Correlation Chart
The statistical analysis conducted on geographies consisting of 120,078,702 people shows a poor positive correlation between the proportion of Pueblo and percentage of population with cognitive disability in the United States with a correlation coefficient (R) of 0.188 and weighted average of 18.7%. Similarly, the statistical analysis conducted on geographies consisting of 471,188,539 people shows a mild negative correlation between the proportion of Immigrants from Philippines and percentage of population with cognitive disability in the United States with a correlation coefficient (R) of -0.338 and weighted average of 16.7%, a difference of 11.6%.
Cognitive Disability Correlation Summary
| Measurement | Pueblo | Immigrants from Philippines |
| Minimum | 3.1% | 7.1% |
| Maximum | 40.9% | 25.9% |
| Range | 37.7% | 18.8% |
| Mean | 18.4% | 15.9% |
| Median | 18.0% | 16.2% |
| Interquartile 25% (IQ1) | 14.7% | 15.2% |
| Interquartile 75% (IQ3) | 22.7% | 16.8% |
| Interquartile Range (IQR) | 8.0% | 1.6% |
| Standard Deviation (Sample) | 6.4% | 2.9% |
| Standard Deviation (Population) | 6.3% | 2.9% |
Similar Demographics by Cognitive Disability
Demographics Similar to Pueblo by Cognitive Disability
In terms of cognitive disability, the demographic groups most similar to Pueblo are Immigrants from Liberia (18.7%, a difference of 0.020%), African (18.6%, a difference of 0.080%), Dominican (18.7%, a difference of 0.12%), Apache (18.6%, a difference of 0.17%), and Indonesian (18.7%, a difference of 0.20%).
| Demographics | Rating | Rank | Cognitive Disability |
| Immigrants | Middle Africa | 0.0 /100 | #316 | Tragic 18.6% |
| Liberians | 0.0 /100 | #317 | Tragic 18.6% |
| Bangladeshis | 0.0 /100 | #318 | Tragic 18.6% |
| Comanche | 0.0 /100 | #319 | Tragic 18.6% |
| Apache | 0.0 /100 | #320 | Tragic 18.6% |
| Africans | 0.0 /100 | #321 | Tragic 18.6% |
| Immigrants | Liberia | 0.0 /100 | #322 | Tragic 18.7% |
| Pueblo | 0.0 /100 | #323 | Tragic 18.7% |
| Dominicans | 0.0 /100 | #324 | Tragic 18.7% |
| Indonesians | 0.0 /100 | #325 | Tragic 18.7% |
| Immigrants | Senegal | 0.0 /100 | #326 | Tragic 18.7% |
| U.S. Virgin Islanders | 0.0 /100 | #327 | Tragic 18.7% |
| Kiowa | 0.0 /100 | #328 | Tragic 18.7% |
| Navajo | 0.0 /100 | #329 | Tragic 18.8% |
| Immigrants | Dominican Republic | 0.0 /100 | #330 | Tragic 18.8% |
Demographics Similar to Immigrants from Philippines by Cognitive Disability
In terms of cognitive disability, the demographic groups most similar to Immigrants from Philippines are Native Hawaiian (16.7%, a difference of 0.060%), Immigrants from South Africa (16.7%, a difference of 0.070%), Immigrants from Moldova (16.7%, a difference of 0.11%), Immigrants from Egypt (16.7%, a difference of 0.11%), and South American (16.7%, a difference of 0.11%).
| Demographics | Rating | Rank | Cognitive Disability |
| Immigrants | Netherlands | 99.2 /100 | #81 | Exceptional 16.7% |
| Swiss | 99.2 /100 | #82 | Exceptional 16.7% |
| Serbians | 99.1 /100 | #83 | Exceptional 16.7% |
| Belgians | 99.1 /100 | #84 | Exceptional 16.7% |
| Immigrants | Moldova | 99.1 /100 | #85 | Exceptional 16.7% |
| Immigrants | South Africa | 99.0 /100 | #86 | Exceptional 16.7% |
| Native Hawaiians | 99.0 /100 | #87 | Exceptional 16.7% |
| Immigrants | Philippines | 99.0 /100 | #88 | Exceptional 16.7% |
| Immigrants | Egypt | 98.8 /100 | #89 | Exceptional 16.7% |
| South Americans | 98.8 /100 | #90 | Exceptional 16.7% |
| Danes | 98.8 /100 | #91 | Exceptional 16.7% |
| Immigrants | South America | 98.8 /100 | #92 | Exceptional 16.7% |
| Immigrants | Southern Europe | 98.7 /100 | #93 | Exceptional 16.7% |
| Asians | 98.7 /100 | #94 | Exceptional 16.7% |
| English | 98.6 /100 | #95 | Exceptional 16.8% |