Pakistani vs Immigrants from Philippines Cognitive Disability
COMPARE
Pakistani
Immigrants from Philippines
Cognitive Disability
Cognitive Disability Comparison
Pakistanis
Immigrants from Philippines
17.3%
COGNITIVE DISABILITY
43.9/ 100
METRIC RATING
180th/ 347
METRIC RANK
16.7%
COGNITIVE DISABILITY
99.0/ 100
METRIC RATING
88th/ 347
METRIC RANK
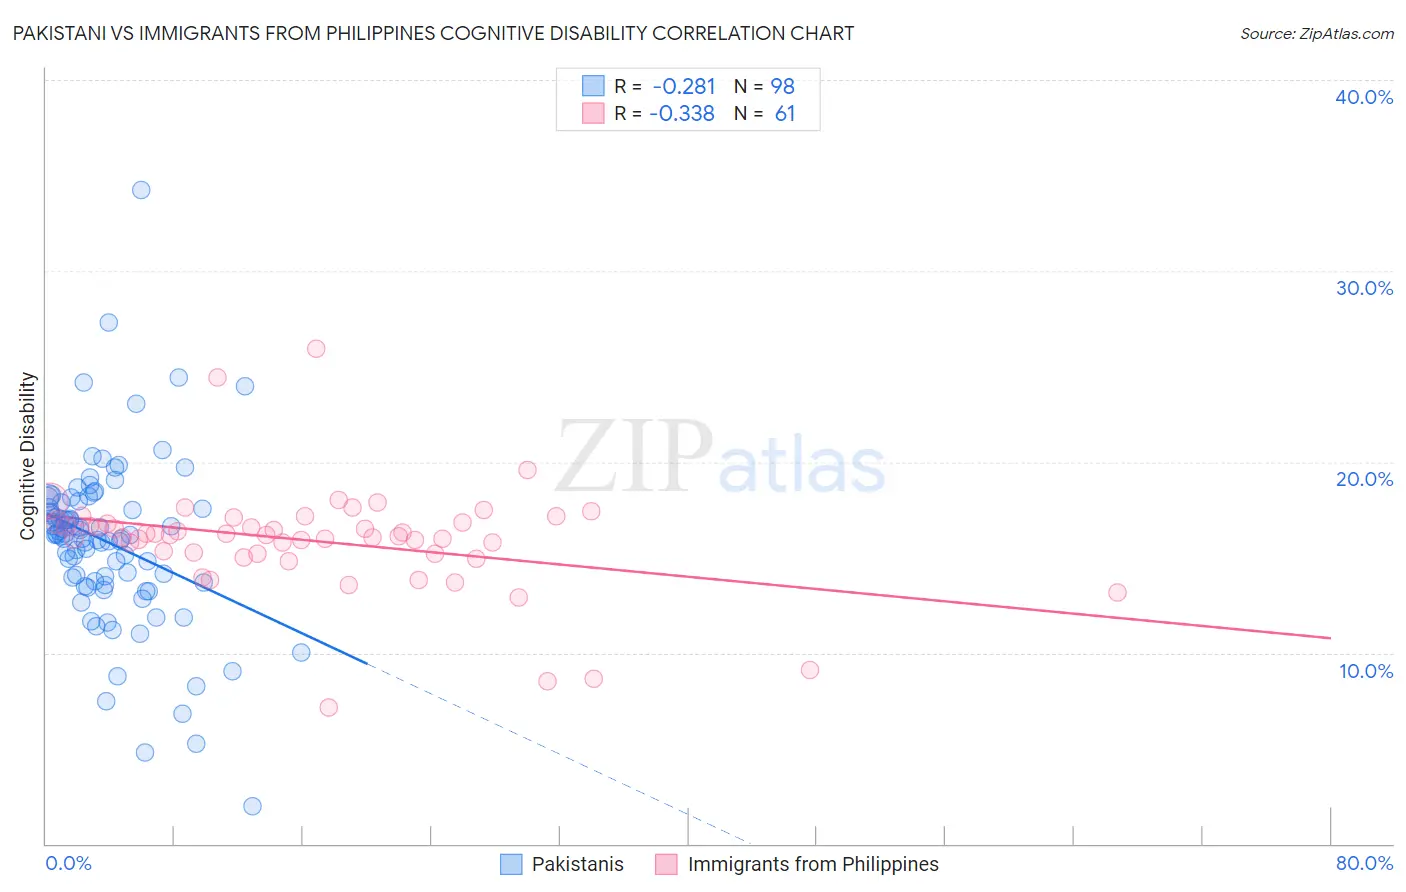
Pakistani vs Immigrants from Philippines Cognitive Disability Correlation Chart
The statistical analysis conducted on geographies consisting of 335,302,267 people shows a weak negative correlation between the proportion of Pakistanis and percentage of population with cognitive disability in the United States with a correlation coefficient (R) of -0.281 and weighted average of 17.3%. Similarly, the statistical analysis conducted on geographies consisting of 471,188,539 people shows a mild negative correlation between the proportion of Immigrants from Philippines and percentage of population with cognitive disability in the United States with a correlation coefficient (R) of -0.338 and weighted average of 16.7%, a difference of 3.5%.
Cognitive Disability Correlation Summary
| Measurement | Pakistani | Immigrants from Philippines |
| Minimum | 2.0% | 7.1% |
| Maximum | 34.2% | 25.9% |
| Range | 32.2% | 18.8% |
| Mean | 15.8% | 15.9% |
| Median | 16.2% | 16.2% |
| Interquartile 25% (IQ1) | 13.7% | 15.2% |
| Interquartile 75% (IQ3) | 17.9% | 16.8% |
| Interquartile Range (IQR) | 4.2% | 1.6% |
| Standard Deviation (Sample) | 4.5% | 2.9% |
| Standard Deviation (Population) | 4.4% | 2.9% |
Similar Demographics by Cognitive Disability
Demographics Similar to Pakistanis by Cognitive Disability
In terms of cognitive disability, the demographic groups most similar to Pakistanis are Immigrants from Guyana (17.3%, a difference of 0.030%), Arab (17.3%, a difference of 0.030%), Spaniard (17.3%, a difference of 0.10%), Sioux (17.3%, a difference of 0.13%), and Spanish (17.3%, a difference of 0.14%).
| Demographics | Rating | Rank | Cognitive Disability |
| Immigrants | Northern Africa | 50.2 /100 | #173 | Average 17.3% |
| Laotians | 50.0 /100 | #174 | Average 17.3% |
| Tsimshian | 49.8 /100 | #175 | Average 17.3% |
| Shoshone | 49.2 /100 | #176 | Average 17.3% |
| Ute | 49.1 /100 | #177 | Average 17.3% |
| Spanish | 48.9 /100 | #178 | Average 17.3% |
| Sioux | 48.6 /100 | #179 | Average 17.3% |
| Pakistanis | 43.9 /100 | #180 | Average 17.3% |
| Immigrants | Guyana | 42.9 /100 | #181 | Average 17.3% |
| Arabs | 42.8 /100 | #182 | Average 17.3% |
| Spaniards | 40.3 /100 | #183 | Average 17.3% |
| Crow | 39.1 /100 | #184 | Fair 17.3% |
| Afghans | 38.2 /100 | #185 | Fair 17.3% |
| Cambodians | 35.9 /100 | #186 | Fair 17.3% |
| Immigrants | Fiji | 33.7 /100 | #187 | Fair 17.4% |
Demographics Similar to Immigrants from Philippines by Cognitive Disability
In terms of cognitive disability, the demographic groups most similar to Immigrants from Philippines are Native Hawaiian (16.7%, a difference of 0.060%), Immigrants from South Africa (16.7%, a difference of 0.070%), Immigrants from Moldova (16.7%, a difference of 0.11%), Immigrants from Egypt (16.7%, a difference of 0.11%), and South American (16.7%, a difference of 0.11%).
| Demographics | Rating | Rank | Cognitive Disability |
| Immigrants | Netherlands | 99.2 /100 | #81 | Exceptional 16.7% |
| Swiss | 99.2 /100 | #82 | Exceptional 16.7% |
| Serbians | 99.1 /100 | #83 | Exceptional 16.7% |
| Belgians | 99.1 /100 | #84 | Exceptional 16.7% |
| Immigrants | Moldova | 99.1 /100 | #85 | Exceptional 16.7% |
| Immigrants | South Africa | 99.0 /100 | #86 | Exceptional 16.7% |
| Native Hawaiians | 99.0 /100 | #87 | Exceptional 16.7% |
| Immigrants | Philippines | 99.0 /100 | #88 | Exceptional 16.7% |
| Immigrants | Egypt | 98.8 /100 | #89 | Exceptional 16.7% |
| South Americans | 98.8 /100 | #90 | Exceptional 16.7% |
| Danes | 98.8 /100 | #91 | Exceptional 16.7% |
| Immigrants | South America | 98.8 /100 | #92 | Exceptional 16.7% |
| Immigrants | Southern Europe | 98.7 /100 | #93 | Exceptional 16.7% |
| Asians | 98.7 /100 | #94 | Exceptional 16.7% |
| English | 98.6 /100 | #95 | Exceptional 16.8% |