Ugandan vs Immigrants from Philippines Cognitive Disability
COMPARE
Ugandan
Immigrants from Philippines
Cognitive Disability
Cognitive Disability Comparison
Ugandans
Immigrants from Philippines
18.3%
COGNITIVE DISABILITY
0.0/ 100
METRIC RATING
307th/ 347
METRIC RANK
16.7%
COGNITIVE DISABILITY
99.0/ 100
METRIC RATING
88th/ 347
METRIC RANK
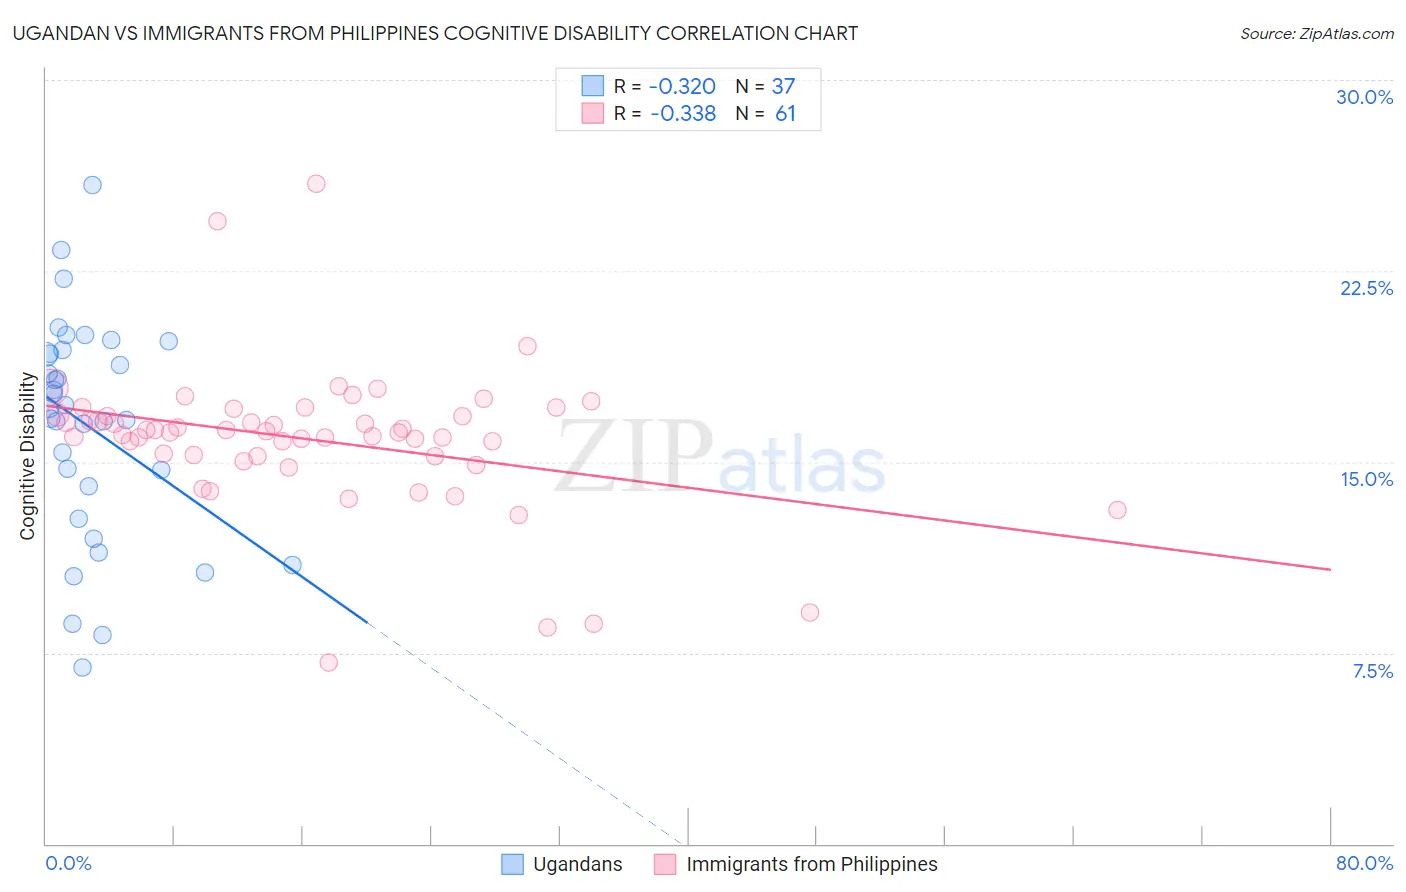
Ugandan vs Immigrants from Philippines Cognitive Disability Correlation Chart
The statistical analysis conducted on geographies consisting of 94,018,576 people shows a mild negative correlation between the proportion of Ugandans and percentage of population with cognitive disability in the United States with a correlation coefficient (R) of -0.320 and weighted average of 18.3%. Similarly, the statistical analysis conducted on geographies consisting of 471,188,539 people shows a mild negative correlation between the proportion of Immigrants from Philippines and percentage of population with cognitive disability in the United States with a correlation coefficient (R) of -0.338 and weighted average of 16.7%, a difference of 9.7%.
Cognitive Disability Correlation Summary
| Measurement | Ugandan | Immigrants from Philippines |
| Minimum | 6.9% | 7.1% |
| Maximum | 25.9% | 25.9% |
| Range | 18.9% | 18.8% |
| Mean | 16.4% | 15.9% |
| Median | 17.1% | 16.2% |
| Interquartile 25% (IQ1) | 13.4% | 15.2% |
| Interquartile 75% (IQ3) | 19.3% | 16.8% |
| Interquartile Range (IQR) | 5.9% | 1.6% |
| Standard Deviation (Sample) | 4.3% | 2.9% |
| Standard Deviation (Population) | 4.2% | 2.9% |
Similar Demographics by Cognitive Disability
Demographics Similar to Ugandans by Cognitive Disability
In terms of cognitive disability, the demographic groups most similar to Ugandans are Seminole (18.3%, a difference of 0.0%), Colville (18.3%, a difference of 0.010%), Immigrants from Western Africa (18.4%, a difference of 0.090%), Immigrants from Eastern Africa (18.4%, a difference of 0.12%), and Immigrants from Eritrea (18.3%, a difference of 0.13%).
| Demographics | Rating | Rank | Cognitive Disability |
| Creek | 0.0 /100 | #300 | Tragic 18.3% |
| Immigrants | Ghana | 0.0 /100 | #301 | Tragic 18.3% |
| Barbadians | 0.0 /100 | #302 | Tragic 18.3% |
| Immigrants | Kenya | 0.0 /100 | #303 | Tragic 18.3% |
| Immigrants | Eritrea | 0.0 /100 | #304 | Tragic 18.3% |
| Colville | 0.0 /100 | #305 | Tragic 18.3% |
| Seminole | 0.0 /100 | #306 | Tragic 18.3% |
| Ugandans | 0.0 /100 | #307 | Tragic 18.3% |
| Immigrants | Western Africa | 0.0 /100 | #308 | Tragic 18.4% |
| Immigrants | Eastern Africa | 0.0 /100 | #309 | Tragic 18.4% |
| Choctaw | 0.0 /100 | #310 | Tragic 18.4% |
| Hmong | 0.0 /100 | #311 | Tragic 18.4% |
| Chickasaw | 0.0 /100 | #312 | Tragic 18.5% |
| Yaqui | 0.0 /100 | #313 | Tragic 18.5% |
| Sub-Saharan Africans | 0.0 /100 | #314 | Tragic 18.5% |
Demographics Similar to Immigrants from Philippines by Cognitive Disability
In terms of cognitive disability, the demographic groups most similar to Immigrants from Philippines are Native Hawaiian (16.7%, a difference of 0.060%), Immigrants from South Africa (16.7%, a difference of 0.070%), Immigrants from Moldova (16.7%, a difference of 0.11%), Immigrants from Egypt (16.7%, a difference of 0.11%), and South American (16.7%, a difference of 0.11%).
| Demographics | Rating | Rank | Cognitive Disability |
| Immigrants | Netherlands | 99.2 /100 | #81 | Exceptional 16.7% |
| Swiss | 99.2 /100 | #82 | Exceptional 16.7% |
| Serbians | 99.1 /100 | #83 | Exceptional 16.7% |
| Belgians | 99.1 /100 | #84 | Exceptional 16.7% |
| Immigrants | Moldova | 99.1 /100 | #85 | Exceptional 16.7% |
| Immigrants | South Africa | 99.0 /100 | #86 | Exceptional 16.7% |
| Native Hawaiians | 99.0 /100 | #87 | Exceptional 16.7% |
| Immigrants | Philippines | 99.0 /100 | #88 | Exceptional 16.7% |
| Immigrants | Egypt | 98.8 /100 | #89 | Exceptional 16.7% |
| South Americans | 98.8 /100 | #90 | Exceptional 16.7% |
| Danes | 98.8 /100 | #91 | Exceptional 16.7% |
| Immigrants | South America | 98.8 /100 | #92 | Exceptional 16.7% |
| Immigrants | Southern Europe | 98.7 /100 | #93 | Exceptional 16.7% |
| Asians | 98.7 /100 | #94 | Exceptional 16.7% |
| English | 98.6 /100 | #95 | Exceptional 16.8% |