Zimbabwean vs Immigrants from Philippines Cognitive Disability
COMPARE
Zimbabwean
Immigrants from Philippines
Cognitive Disability
Cognitive Disability Comparison
Zimbabweans
Immigrants from Philippines
17.6%
COGNITIVE DISABILITY
6.1/ 100
METRIC RATING
220th/ 347
METRIC RANK
16.7%
COGNITIVE DISABILITY
99.0/ 100
METRIC RATING
88th/ 347
METRIC RANK
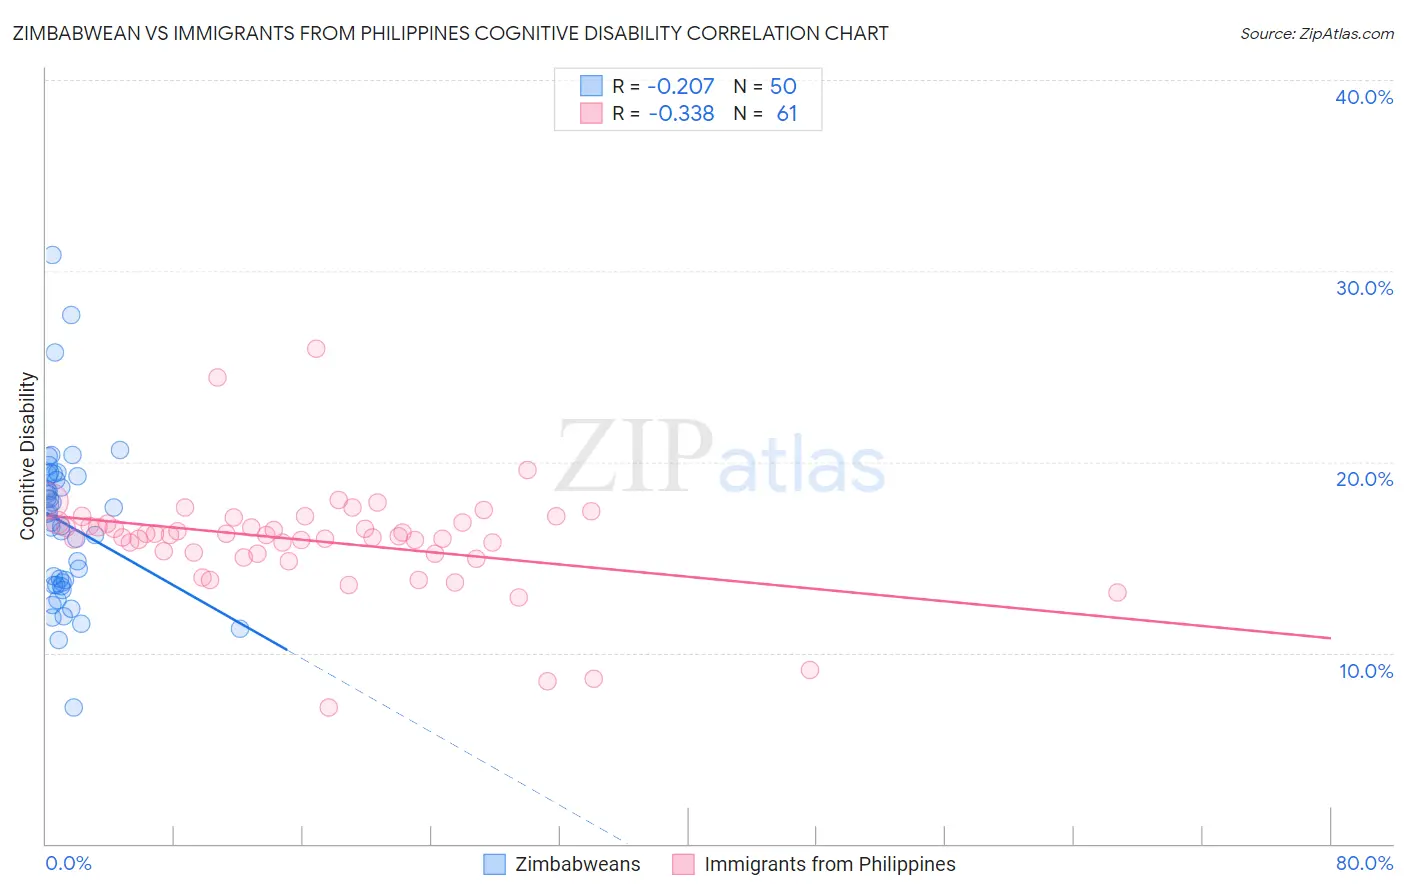
Zimbabwean vs Immigrants from Philippines Cognitive Disability Correlation Chart
The statistical analysis conducted on geographies consisting of 69,204,510 people shows a weak negative correlation between the proportion of Zimbabweans and percentage of population with cognitive disability in the United States with a correlation coefficient (R) of -0.207 and weighted average of 17.6%. Similarly, the statistical analysis conducted on geographies consisting of 471,188,539 people shows a mild negative correlation between the proportion of Immigrants from Philippines and percentage of population with cognitive disability in the United States with a correlation coefficient (R) of -0.338 and weighted average of 16.7%, a difference of 5.4%.
Cognitive Disability Correlation Summary
| Measurement | Zimbabwean | Immigrants from Philippines |
| Minimum | 7.2% | 7.1% |
| Maximum | 30.8% | 25.9% |
| Range | 23.7% | 18.8% |
| Mean | 16.8% | 15.9% |
| Median | 17.1% | 16.2% |
| Interquartile 25% (IQ1) | 13.6% | 15.2% |
| Interquartile 75% (IQ3) | 19.2% | 16.8% |
| Interquartile Range (IQR) | 5.6% | 1.6% |
| Standard Deviation (Sample) | 4.3% | 2.9% |
| Standard Deviation (Population) | 4.2% | 2.9% |
Similar Demographics by Cognitive Disability
Demographics Similar to Zimbabweans by Cognitive Disability
In terms of cognitive disability, the demographic groups most similar to Zimbabweans are Moroccan (17.6%, a difference of 0.020%), Immigrants from Sierra Leone (17.6%, a difference of 0.030%), Icelander (17.6%, a difference of 0.040%), Salvadoran (17.6%, a difference of 0.070%), and Okinawan (17.6%, a difference of 0.090%).
| Demographics | Rating | Rank | Cognitive Disability |
| Hawaiians | 7.2 /100 | #213 | Tragic 17.6% |
| Immigrants | El Salvador | 7.0 /100 | #214 | Tragic 17.6% |
| Alaskan Athabascans | 6.9 /100 | #215 | Tragic 17.6% |
| Okinawans | 6.8 /100 | #216 | Tragic 17.6% |
| Salvadorans | 6.7 /100 | #217 | Tragic 17.6% |
| Icelanders | 6.4 /100 | #218 | Tragic 17.6% |
| Immigrants | Sierra Leone | 6.3 /100 | #219 | Tragic 17.6% |
| Zimbabweans | 6.1 /100 | #220 | Tragic 17.6% |
| Moroccans | 5.9 /100 | #221 | Tragic 17.6% |
| Central Americans | 4.5 /100 | #222 | Tragic 17.7% |
| Alsatians | 4.5 /100 | #223 | Tragic 17.7% |
| Fijians | 3.4 /100 | #224 | Tragic 17.7% |
| Vietnamese | 3.4 /100 | #225 | Tragic 17.7% |
| Marshallese | 2.7 /100 | #226 | Tragic 17.7% |
| Immigrants | St. Vincent and the Grenadines | 2.6 /100 | #227 | Tragic 17.7% |
Demographics Similar to Immigrants from Philippines by Cognitive Disability
In terms of cognitive disability, the demographic groups most similar to Immigrants from Philippines are Native Hawaiian (16.7%, a difference of 0.060%), Immigrants from South Africa (16.7%, a difference of 0.070%), Immigrants from Moldova (16.7%, a difference of 0.11%), Immigrants from Egypt (16.7%, a difference of 0.11%), and South American (16.7%, a difference of 0.11%).
| Demographics | Rating | Rank | Cognitive Disability |
| Immigrants | Netherlands | 99.2 /100 | #81 | Exceptional 16.7% |
| Swiss | 99.2 /100 | #82 | Exceptional 16.7% |
| Serbians | 99.1 /100 | #83 | Exceptional 16.7% |
| Belgians | 99.1 /100 | #84 | Exceptional 16.7% |
| Immigrants | Moldova | 99.1 /100 | #85 | Exceptional 16.7% |
| Immigrants | South Africa | 99.0 /100 | #86 | Exceptional 16.7% |
| Native Hawaiians | 99.0 /100 | #87 | Exceptional 16.7% |
| Immigrants | Philippines | 99.0 /100 | #88 | Exceptional 16.7% |
| Immigrants | Egypt | 98.8 /100 | #89 | Exceptional 16.7% |
| South Americans | 98.8 /100 | #90 | Exceptional 16.7% |
| Danes | 98.8 /100 | #91 | Exceptional 16.7% |
| Immigrants | South America | 98.8 /100 | #92 | Exceptional 16.7% |
| Immigrants | Southern Europe | 98.7 /100 | #93 | Exceptional 16.7% |
| Asians | 98.7 /100 | #94 | Exceptional 16.7% |
| English | 98.6 /100 | #95 | Exceptional 16.8% |