Immigrants from Lebanon vs Immigrants from Philippines Cognitive Disability
COMPARE
Immigrants from Lebanon
Immigrants from Philippines
Cognitive Disability
Cognitive Disability Comparison
Immigrants from Lebanon
Immigrants from Philippines
16.8%
COGNITIVE DISABILITY
98.4/ 100
METRIC RATING
98th/ 347
METRIC RANK
16.7%
COGNITIVE DISABILITY
99.0/ 100
METRIC RATING
88th/ 347
METRIC RANK
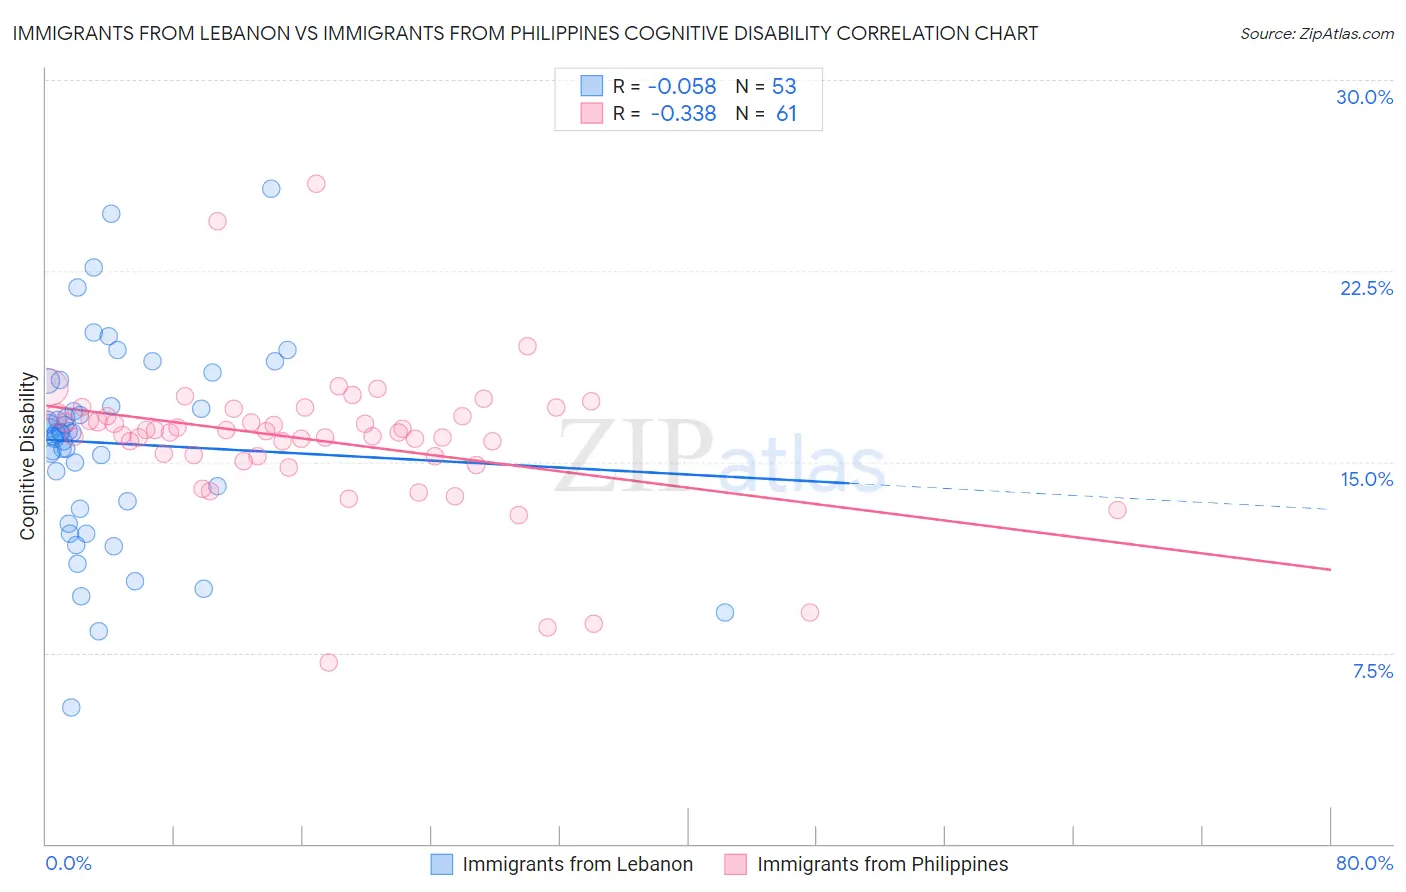
Immigrants from Lebanon vs Immigrants from Philippines Cognitive Disability Correlation Chart
The statistical analysis conducted on geographies consisting of 217,153,550 people shows a slight negative correlation between the proportion of Immigrants from Lebanon and percentage of population with cognitive disability in the United States with a correlation coefficient (R) of -0.058 and weighted average of 16.8%. Similarly, the statistical analysis conducted on geographies consisting of 471,188,539 people shows a mild negative correlation between the proportion of Immigrants from Philippines and percentage of population with cognitive disability in the United States with a correlation coefficient (R) of -0.338 and weighted average of 16.7%, a difference of 0.30%.
Cognitive Disability Correlation Summary
| Measurement | Immigrants from Lebanon | Immigrants from Philippines |
| Minimum | 5.4% | 7.1% |
| Maximum | 25.7% | 25.9% |
| Range | 20.3% | 18.8% |
| Mean | 15.7% | 15.9% |
| Median | 16.1% | 16.2% |
| Interquartile 25% (IQ1) | 13.3% | 15.2% |
| Interquartile 75% (IQ3) | 17.7% | 16.8% |
| Interquartile Range (IQR) | 4.4% | 1.6% |
| Standard Deviation (Sample) | 3.9% | 2.9% |
| Standard Deviation (Population) | 3.9% | 2.9% |
Demographics Similar to Immigrants from Lebanon and Immigrants from Philippines by Cognitive Disability
In terms of cognitive disability, the demographic groups most similar to Immigrants from Lebanon are Dutch (16.8%, a difference of 0.020%), Finnish (16.8%, a difference of 0.040%), English (16.8%, a difference of 0.060%), Jordanian (16.8%, a difference of 0.090%), and Asian (16.7%, a difference of 0.12%). Similarly, the demographic groups most similar to Immigrants from Philippines are Native Hawaiian (16.7%, a difference of 0.060%), Immigrants from South Africa (16.7%, a difference of 0.070%), Immigrants from Moldova (16.7%, a difference of 0.11%), Immigrants from Egypt (16.7%, a difference of 0.11%), and South American (16.7%, a difference of 0.11%).
| Demographics | Rating | Rank | Cognitive Disability |
| Serbians | 99.1 /100 | #83 | Exceptional 16.7% |
| Belgians | 99.1 /100 | #84 | Exceptional 16.7% |
| Immigrants | Moldova | 99.1 /100 | #85 | Exceptional 16.7% |
| Immigrants | South Africa | 99.0 /100 | #86 | Exceptional 16.7% |
| Native Hawaiians | 99.0 /100 | #87 | Exceptional 16.7% |
| Immigrants | Philippines | 99.0 /100 | #88 | Exceptional 16.7% |
| Immigrants | Egypt | 98.8 /100 | #89 | Exceptional 16.7% |
| South Americans | 98.8 /100 | #90 | Exceptional 16.7% |
| Danes | 98.8 /100 | #91 | Exceptional 16.7% |
| Immigrants | South America | 98.8 /100 | #92 | Exceptional 16.7% |
| Immigrants | Southern Europe | 98.7 /100 | #93 | Exceptional 16.7% |
| Asians | 98.7 /100 | #94 | Exceptional 16.7% |
| English | 98.6 /100 | #95 | Exceptional 16.8% |
| Finns | 98.5 /100 | #96 | Exceptional 16.8% |
| Dutch | 98.5 /100 | #97 | Exceptional 16.8% |
| Immigrants | Lebanon | 98.4 /100 | #98 | Exceptional 16.8% |
| Jordanians | 98.2 /100 | #99 | Exceptional 16.8% |
| Immigrants | Russia | 98.2 /100 | #100 | Exceptional 16.8% |
| Immigrants | Asia | 98.1 /100 | #101 | Exceptional 16.8% |
| Irish | 98.1 /100 | #102 | Exceptional 16.8% |
| Paraguayans | 98.0 /100 | #103 | Exceptional 16.8% |