Romanian vs Immigrants from Cuba Hearing Disability
COMPARE
Romanian
Immigrants from Cuba
Hearing Disability
Hearing Disability Comparison
Romanians
Immigrants from Cuba
3.1%
HEARING DISABILITY
12.1/ 100
METRIC RATING
211th/ 347
METRIC RANK
2.7%
HEARING DISABILITY
97.2/ 100
METRIC RATING
83rd/ 347
METRIC RANK
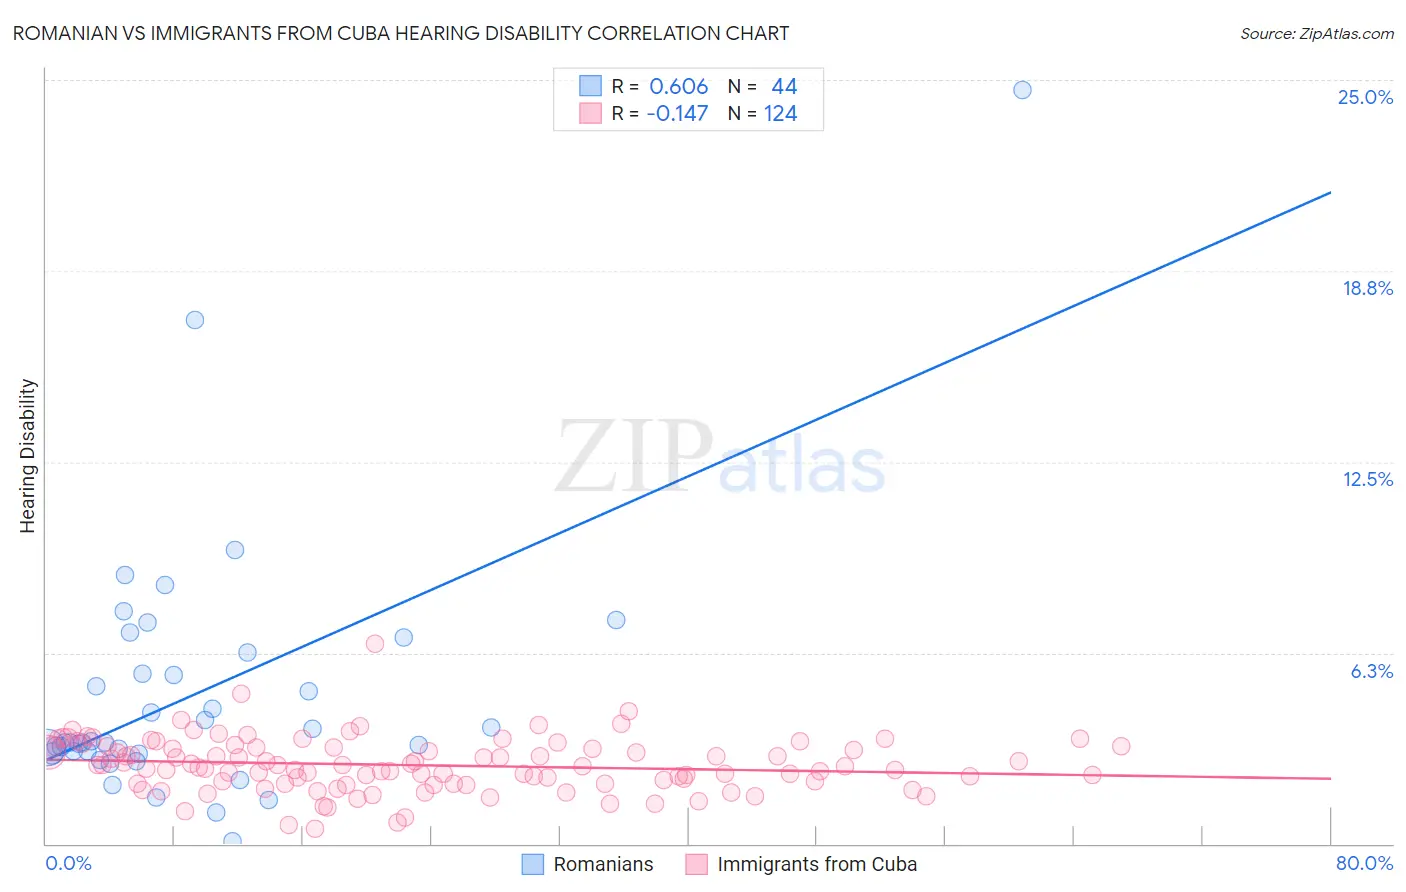
Romanian vs Immigrants from Cuba Hearing Disability Correlation Chart
The statistical analysis conducted on geographies consisting of 377,801,954 people shows a significant positive correlation between the proportion of Romanians and percentage of population with hearing disability in the United States with a correlation coefficient (R) of 0.606 and weighted average of 3.1%. Similarly, the statistical analysis conducted on geographies consisting of 325,940,819 people shows a poor negative correlation between the proportion of Immigrants from Cuba and percentage of population with hearing disability in the United States with a correlation coefficient (R) of -0.147 and weighted average of 2.7%, a difference of 14.1%.
Hearing Disability Correlation Summary
| Measurement | Romanian | Immigrants from Cuba |
| Minimum | 0.091% | 0.47% |
| Maximum | 24.7% | 6.5% |
| Range | 24.6% | 6.1% |
| Mean | 4.9% | 2.6% |
| Median | 3.3% | 2.5% |
| Interquartile 25% (IQ1) | 3.0% | 2.0% |
| Interquartile 75% (IQ3) | 5.9% | 3.2% |
| Interquartile Range (IQR) | 2.9% | 1.2% |
| Standard Deviation (Sample) | 4.2% | 0.88% |
| Standard Deviation (Population) | 4.2% | 0.88% |
Similar Demographics by Hearing Disability
Demographics Similar to Romanians by Hearing Disability
In terms of hearing disability, the demographic groups most similar to Romanians are Cape Verdean (3.1%, a difference of 0.040%), Immigrants from Hungary (3.1%, a difference of 0.080%), Immigrants from Latvia (3.1%, a difference of 0.13%), Pakistani (3.1%, a difference of 0.21%), and Immigrants from Iraq (3.1%, a difference of 0.36%).
| Demographics | Rating | Rank | Hearing Disability |
| Immigrants | Czechoslovakia | 15.9 /100 | #204 | Poor 3.1% |
| Alsatians | 15.9 /100 | #205 | Poor 3.1% |
| Eastern Europeans | 15.5 /100 | #206 | Poor 3.1% |
| Hispanics or Latinos | 15.1 /100 | #207 | Poor 3.1% |
| Immigrants | Latvia | 12.7 /100 | #208 | Poor 3.1% |
| Immigrants | Hungary | 12.5 /100 | #209 | Poor 3.1% |
| Cape Verdeans | 12.2 /100 | #210 | Poor 3.1% |
| Romanians | 12.1 /100 | #211 | Poor 3.1% |
| Pakistanis | 11.1 /100 | #212 | Poor 3.1% |
| Immigrants | Iraq | 10.5 /100 | #213 | Poor 3.1% |
| Australians | 8.1 /100 | #214 | Tragic 3.2% |
| Bangladeshis | 8.1 /100 | #215 | Tragic 3.2% |
| Immigrants | Norway | 7.3 /100 | #216 | Tragic 3.2% |
| Russians | 7.1 /100 | #217 | Tragic 3.2% |
| Immigrants | Northern Europe | 7.0 /100 | #218 | Tragic 3.2% |
Demographics Similar to Immigrants from Cuba by Hearing Disability
In terms of hearing disability, the demographic groups most similar to Immigrants from Cuba are Immigrants from Armenia (2.7%, a difference of 0.020%), Immigrants from Uruguay (2.7%, a difference of 0.030%), Immigrants from Asia (2.7%, a difference of 0.060%), Immigrants from Argentina (2.8%, a difference of 0.19%), and Colombian (2.7%, a difference of 0.25%).
| Demographics | Rating | Rank | Hearing Disability |
| Asians | 97.5 /100 | #76 | Exceptional 2.7% |
| Immigrants | Malaysia | 97.5 /100 | #77 | Exceptional 2.7% |
| Mongolians | 97.4 /100 | #78 | Exceptional 2.7% |
| Colombians | 97.4 /100 | #79 | Exceptional 2.7% |
| Immigrants | Asia | 97.2 /100 | #80 | Exceptional 2.7% |
| Immigrants | Uruguay | 97.2 /100 | #81 | Exceptional 2.7% |
| Immigrants | Armenia | 97.2 /100 | #82 | Exceptional 2.7% |
| Immigrants | Cuba | 97.2 /100 | #83 | Exceptional 2.7% |
| Immigrants | Argentina | 97.0 /100 | #84 | Exceptional 2.8% |
| Immigrants | Northern Africa | 96.9 /100 | #85 | Exceptional 2.8% |
| Immigrants | Iran | 96.8 /100 | #86 | Exceptional 2.8% |
| Somalis | 96.7 /100 | #87 | Exceptional 2.8% |
| Immigrants | Turkey | 96.7 /100 | #88 | Exceptional 2.8% |
| Belizeans | 96.6 /100 | #89 | Exceptional 2.8% |
| Immigrants | Morocco | 96.6 /100 | #90 | Exceptional 2.8% |