German vs Immigrants from Cuba Hearing Disability
COMPARE
German
Immigrants from Cuba
Hearing Disability
Hearing Disability Comparison
Germans
Immigrants from Cuba
3.7%
HEARING DISABILITY
0.0/ 100
METRIC RATING
299th/ 347
METRIC RANK
2.7%
HEARING DISABILITY
97.2/ 100
METRIC RATING
83rd/ 347
METRIC RANK
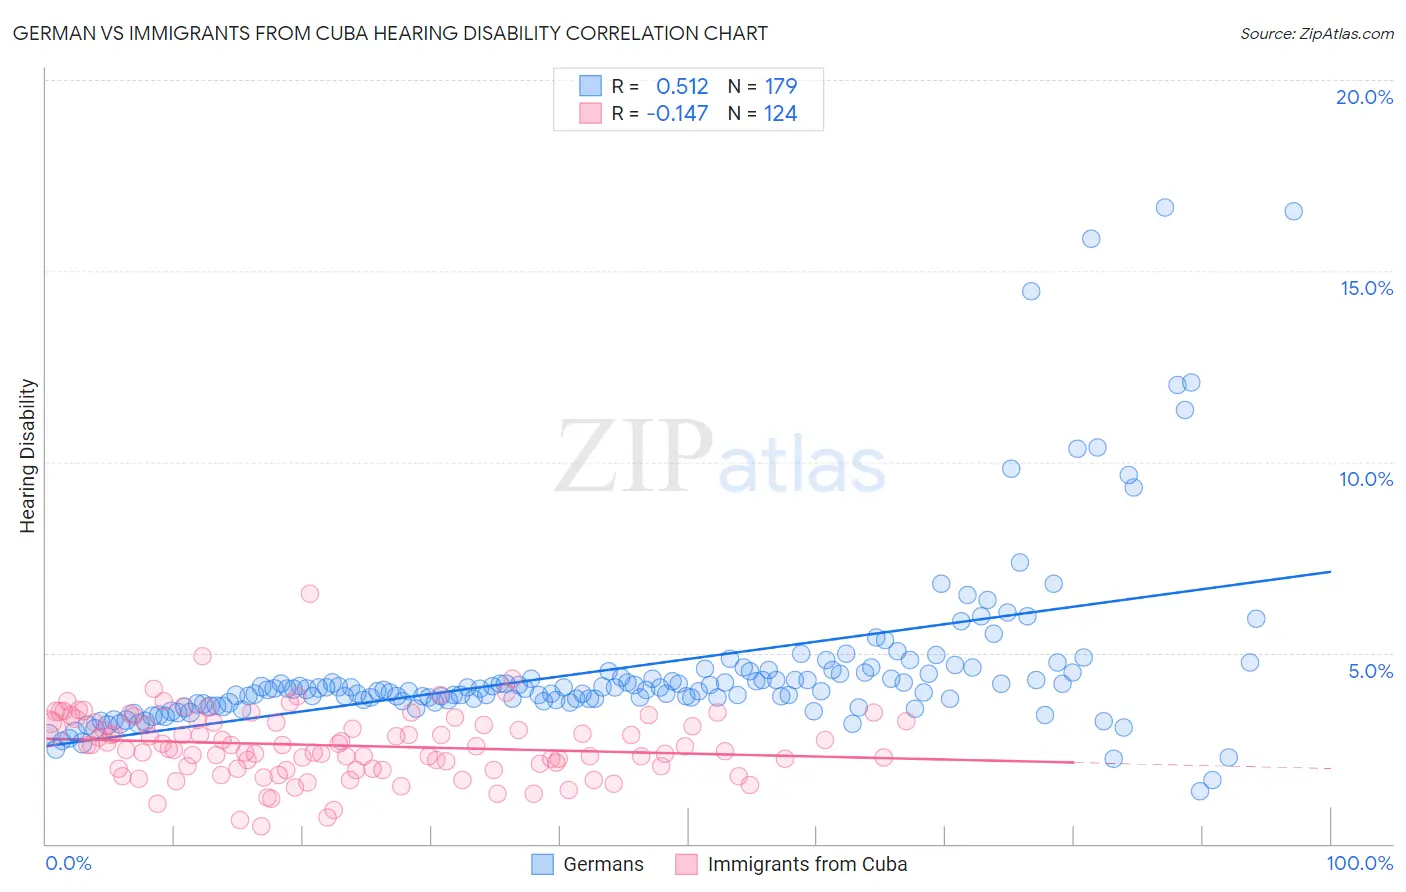
German vs Immigrants from Cuba Hearing Disability Correlation Chart
The statistical analysis conducted on geographies consisting of 580,131,605 people shows a substantial positive correlation between the proportion of Germans and percentage of population with hearing disability in the United States with a correlation coefficient (R) of 0.512 and weighted average of 3.7%. Similarly, the statistical analysis conducted on geographies consisting of 325,940,819 people shows a poor negative correlation between the proportion of Immigrants from Cuba and percentage of population with hearing disability in the United States with a correlation coefficient (R) of -0.147 and weighted average of 2.7%, a difference of 35.9%.
Hearing Disability Correlation Summary
| Measurement | German | Immigrants from Cuba |
| Minimum | 1.4% | 0.47% |
| Maximum | 16.7% | 6.5% |
| Range | 15.3% | 6.1% |
| Mean | 4.6% | 2.6% |
| Median | 4.1% | 2.5% |
| Interquartile 25% (IQ1) | 3.7% | 2.0% |
| Interquartile 75% (IQ3) | 4.5% | 3.2% |
| Interquartile Range (IQR) | 0.75% | 1.2% |
| Standard Deviation (Sample) | 2.3% | 0.88% |
| Standard Deviation (Population) | 2.3% | 0.88% |
Similar Demographics by Hearing Disability
Demographics Similar to Germans by Hearing Disability
In terms of hearing disability, the demographic groups most similar to Germans are Scottish (3.7%, a difference of 0.060%), Pennsylvania German (3.7%, a difference of 0.090%), Dutch (3.7%, a difference of 0.20%), Menominee (3.7%, a difference of 0.25%), and Celtic (3.7%, a difference of 0.28%).
| Demographics | Rating | Rank | Hearing Disability |
| Native Hawaiians | 0.0 /100 | #292 | Tragic 3.7% |
| Norwegians | 0.0 /100 | #293 | Tragic 3.7% |
| Iroquois | 0.0 /100 | #294 | Tragic 3.7% |
| Welsh | 0.0 /100 | #295 | Tragic 3.7% |
| Pima | 0.0 /100 | #296 | Tragic 3.7% |
| Immigrants | Azores | 0.0 /100 | #297 | Tragic 3.7% |
| Celtics | 0.0 /100 | #298 | Tragic 3.7% |
| Germans | 0.0 /100 | #299 | Tragic 3.7% |
| Scottish | 0.0 /100 | #300 | Tragic 3.7% |
| Pennsylvania Germans | 0.0 /100 | #301 | Tragic 3.7% |
| Dutch | 0.0 /100 | #302 | Tragic 3.7% |
| Menominee | 0.0 /100 | #303 | Tragic 3.7% |
| French | 0.0 /100 | #304 | Tragic 3.8% |
| English | 0.0 /100 | #305 | Tragic 3.8% |
| Marshallese | 0.0 /100 | #306 | Tragic 3.8% |
Demographics Similar to Immigrants from Cuba by Hearing Disability
In terms of hearing disability, the demographic groups most similar to Immigrants from Cuba are Immigrants from Armenia (2.7%, a difference of 0.020%), Immigrants from Uruguay (2.7%, a difference of 0.030%), Immigrants from Asia (2.7%, a difference of 0.060%), Immigrants from Argentina (2.8%, a difference of 0.19%), and Colombian (2.7%, a difference of 0.25%).
| Demographics | Rating | Rank | Hearing Disability |
| Asians | 97.5 /100 | #76 | Exceptional 2.7% |
| Immigrants | Malaysia | 97.5 /100 | #77 | Exceptional 2.7% |
| Mongolians | 97.4 /100 | #78 | Exceptional 2.7% |
| Colombians | 97.4 /100 | #79 | Exceptional 2.7% |
| Immigrants | Asia | 97.2 /100 | #80 | Exceptional 2.7% |
| Immigrants | Uruguay | 97.2 /100 | #81 | Exceptional 2.7% |
| Immigrants | Armenia | 97.2 /100 | #82 | Exceptional 2.7% |
| Immigrants | Cuba | 97.2 /100 | #83 | Exceptional 2.7% |
| Immigrants | Argentina | 97.0 /100 | #84 | Exceptional 2.8% |
| Immigrants | Northern Africa | 96.9 /100 | #85 | Exceptional 2.8% |
| Immigrants | Iran | 96.8 /100 | #86 | Exceptional 2.8% |
| Somalis | 96.7 /100 | #87 | Exceptional 2.8% |
| Immigrants | Turkey | 96.7 /100 | #88 | Exceptional 2.8% |
| Belizeans | 96.6 /100 | #89 | Exceptional 2.8% |
| Immigrants | Morocco | 96.6 /100 | #90 | Exceptional 2.8% |