Pueblo vs Immigrants from Cuba 12th Grade, No Diploma
COMPARE
Pueblo
Immigrants from Cuba
12th Grade, No Diploma
12th Grade, No Diploma Comparison
Pueblo
Immigrants from Cuba
88.2%
12TH GRADE, NO DIPLOMA
0.0/ 100
METRIC RATING
297th/ 347
METRIC RANK
87.5%
12TH GRADE, NO DIPLOMA
0.0/ 100
METRIC RATING
310th/ 347
METRIC RANK
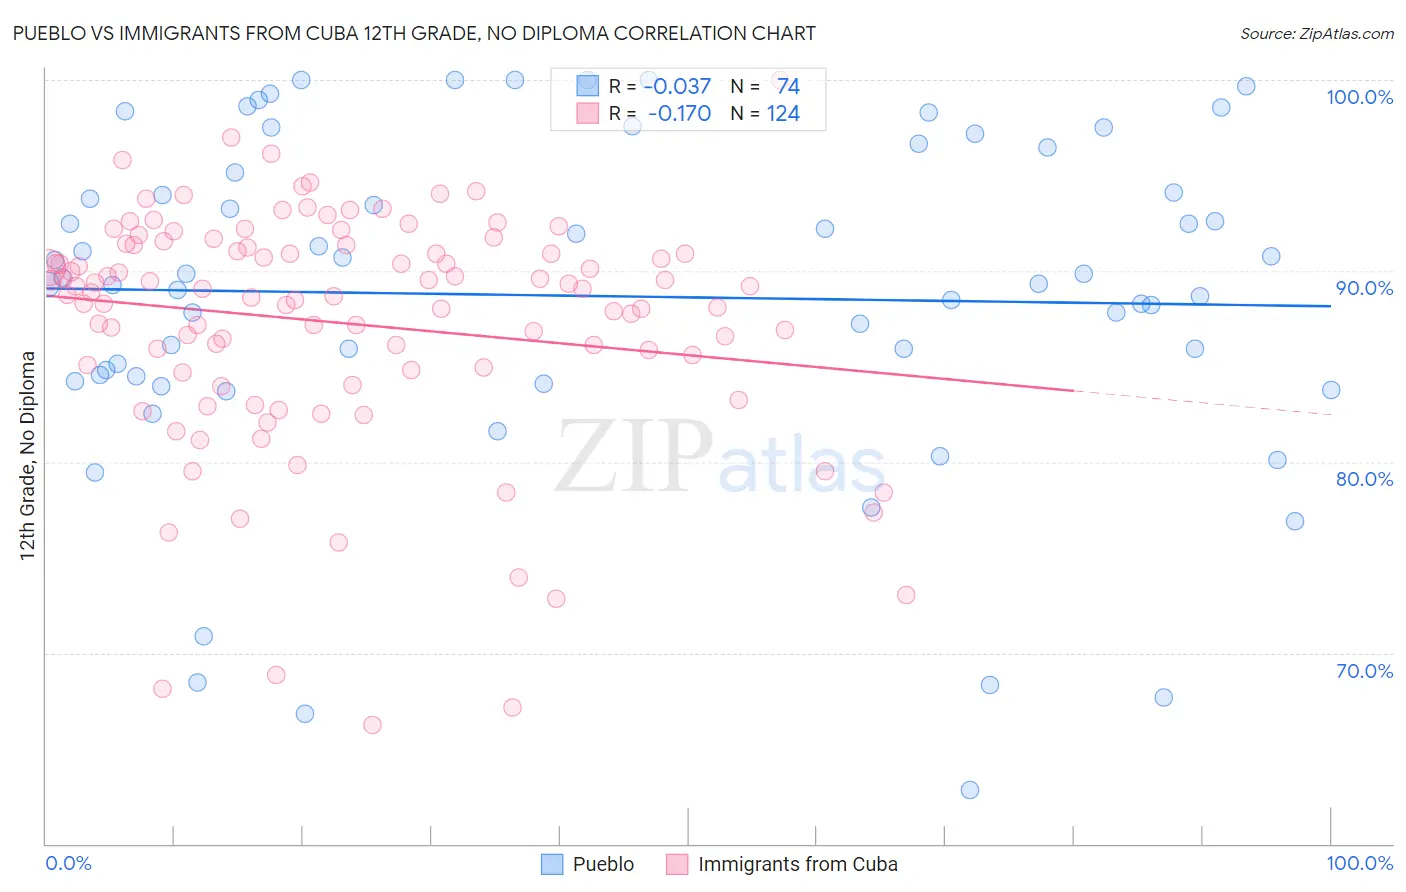
Pueblo vs Immigrants from Cuba 12th Grade, No Diploma Correlation Chart
The statistical analysis conducted on geographies consisting of 120,086,593 people shows no correlation between the proportion of Pueblo and percentage of population with at least 12th grade (no diploma) education in the United States with a correlation coefficient (R) of -0.037 and weighted average of 88.2%. Similarly, the statistical analysis conducted on geographies consisting of 326,028,015 people shows a poor negative correlation between the proportion of Immigrants from Cuba and percentage of population with at least 12th grade (no diploma) education in the United States with a correlation coefficient (R) of -0.170 and weighted average of 87.5%, a difference of 0.76%.
12th Grade, No Diploma Correlation Summary
| Measurement | Pueblo | Immigrants from Cuba |
| Minimum | 62.8% | 66.2% |
| Maximum | 100.0% | 100.0% |
| Range | 37.2% | 33.8% |
| Mean | 88.7% | 87.3% |
| Median | 89.5% | 89.0% |
| Interquartile 25% (IQ1) | 84.5% | 84.9% |
| Interquartile 75% (IQ3) | 95.1% | 91.3% |
| Interquartile Range (IQR) | 10.7% | 6.4% |
| Standard Deviation (Sample) | 8.7% | 6.2% |
| Standard Deviation (Population) | 8.7% | 6.2% |
Demographics Similar to Pueblo and Immigrants from Cuba by 12th Grade, No Diploma
In terms of 12th grade, no diploma, the demographic groups most similar to Pueblo are Fijian (88.2%, a difference of 0.010%), Immigrants (88.2%, a difference of 0.030%), Immigrants from Haiti (88.2%, a difference of 0.050%), Guyanese (88.3%, a difference of 0.070%), and Nepalese (88.1%, a difference of 0.10%). Similarly, the demographic groups most similar to Immigrants from Cuba are Yaqui (87.5%, a difference of 0.040%), Immigrants from Armenia (87.6%, a difference of 0.050%), Immigrants from Ecuador (87.5%, a difference of 0.050%), Yup'ik (87.6%, a difference of 0.080%), and Immigrants from Portugal (87.6%, a difference of 0.12%).
| Demographics | Rating | Rank | 12th Grade, No Diploma |
| Japanese | 0.0 /100 | #293 | Tragic 88.3% |
| Guyanese | 0.0 /100 | #294 | Tragic 88.3% |
| Immigrants | Immigrants | 0.0 /100 | #295 | Tragic 88.2% |
| Fijians | 0.0 /100 | #296 | Tragic 88.2% |
| Pueblo | 0.0 /100 | #297 | Tragic 88.2% |
| Immigrants | Haiti | 0.0 /100 | #298 | Tragic 88.2% |
| Nepalese | 0.0 /100 | #299 | Tragic 88.1% |
| Immigrants | Guyana | 0.0 /100 | #300 | Tragic 88.1% |
| Immigrants | Cambodia | 0.0 /100 | #301 | Tragic 88.1% |
| Ecuadorians | 0.0 /100 | #302 | Tragic 88.0% |
| Immigrants | Bangladesh | 0.0 /100 | #303 | Tragic 88.0% |
| Vietnamese | 0.0 /100 | #304 | Tragic 87.9% |
| Immigrants | Dominica | 0.0 /100 | #305 | Tragic 87.7% |
| Natives/Alaskans | 0.0 /100 | #306 | Tragic 87.7% |
| Immigrants | Portugal | 0.0 /100 | #307 | Tragic 87.6% |
| Yup'ik | 0.0 /100 | #308 | Tragic 87.6% |
| Immigrants | Armenia | 0.0 /100 | #309 | Tragic 87.6% |
| Immigrants | Cuba | 0.0 /100 | #310 | Tragic 87.5% |
| Yaqui | 0.0 /100 | #311 | Tragic 87.5% |
| Immigrants | Ecuador | 0.0 /100 | #312 | Tragic 87.5% |
| Immigrants | Caribbean | 0.0 /100 | #313 | Tragic 87.4% |