Pueblo vs Colombian Unemployment Among Youth under 25 years
COMPARE
Pueblo
Colombian
Unemployment Among Youth under 25 years
Unemployment Among Youth under 25 years Comparison
Pueblo
Colombians
13.9%
UNEMPLOYMENT AMONG YOUTH UNDER 25 YEARS
0.0/ 100
METRIC RATING
306th/ 347
METRIC RANK
11.9%
UNEMPLOYMENT AMONG YOUTH UNDER 25 YEARS
9.1/ 100
METRIC RATING
212th/ 347
METRIC RANK
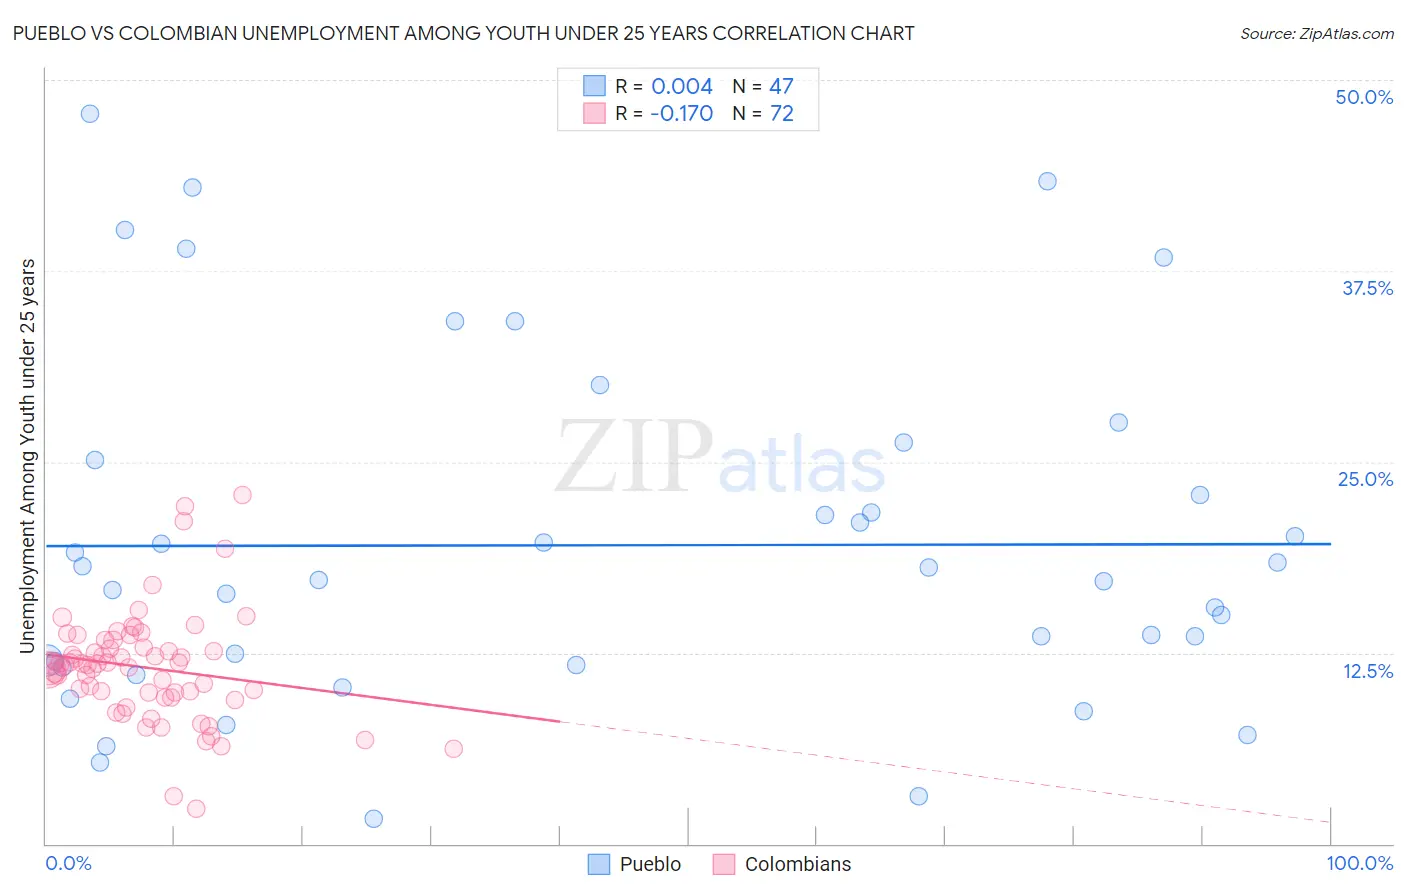
Pueblo vs Colombian Unemployment Among Youth under 25 years Correlation Chart
The statistical analysis conducted on geographies consisting of 119,696,762 people shows no correlation between the proportion of Pueblo and unemployment rate among youth under the age of 25 in the United States with a correlation coefficient (R) of 0.004 and weighted average of 13.9%. Similarly, the statistical analysis conducted on geographies consisting of 414,681,795 people shows a poor negative correlation between the proportion of Colombians and unemployment rate among youth under the age of 25 in the United States with a correlation coefficient (R) of -0.170 and weighted average of 11.9%, a difference of 16.9%.
Unemployment Among Youth under 25 years Correlation Summary
| Measurement | Pueblo | Colombian |
| Minimum | 1.6% | 2.3% |
| Maximum | 47.8% | 22.8% |
| Range | 46.2% | 20.5% |
| Mean | 19.5% | 11.5% |
| Median | 17.3% | 11.7% |
| Interquartile 25% (IQ1) | 11.7% | 9.7% |
| Interquartile 75% (IQ3) | 25.1% | 13.1% |
| Interquartile Range (IQR) | 13.4% | 3.4% |
| Standard Deviation (Sample) | 11.3% | 3.6% |
| Standard Deviation (Population) | 11.2% | 3.6% |
Similar Demographics by Unemployment Among Youth under 25 years
Demographics Similar to Pueblo by Unemployment Among Youth under 25 years
In terms of unemployment among youth under 25 years, the demographic groups most similar to Pueblo are Haitian (13.9%, a difference of 0.070%), Belizean (13.8%, a difference of 0.40%), Houma (13.8%, a difference of 0.40%), Immigrants from Sierra Leone (13.8%, a difference of 0.44%), and Immigrants from Senegal (13.8%, a difference of 0.49%).
| Demographics | Rating | Rank | Unemployment Among Youth under 25 years |
| Tohono O'odham | 0.0 /100 | #299 | Tragic 13.8% |
| Immigrants | Cabo Verde | 0.0 /100 | #300 | Tragic 13.8% |
| Immigrants | Senegal | 0.0 /100 | #301 | Tragic 13.8% |
| Immigrants | Sierra Leone | 0.0 /100 | #302 | Tragic 13.8% |
| Belizeans | 0.0 /100 | #303 | Tragic 13.8% |
| Houma | 0.0 /100 | #304 | Tragic 13.8% |
| Haitians | 0.0 /100 | #305 | Tragic 13.9% |
| Pueblo | 0.0 /100 | #306 | Tragic 13.9% |
| Immigrants | Haiti | 0.0 /100 | #307 | Tragic 14.0% |
| Immigrants | Belize | 0.0 /100 | #308 | Tragic 14.0% |
| Aleuts | 0.0 /100 | #309 | Tragic 14.1% |
| Immigrants | West Indies | 0.0 /100 | #310 | Tragic 14.2% |
| Immigrants | Bangladesh | 0.0 /100 | #311 | Tragic 14.2% |
| Vietnamese | 0.0 /100 | #312 | Tragic 14.3% |
| Immigrants | Armenia | 0.0 /100 | #313 | Tragic 14.4% |
Demographics Similar to Colombians by Unemployment Among Youth under 25 years
In terms of unemployment among youth under 25 years, the demographic groups most similar to Colombians are Immigrants from Philippines (11.9%, a difference of 0.010%), South American (11.9%, a difference of 0.070%), Assyrian/Chaldean/Syriac (11.9%, a difference of 0.090%), Costa Rican (11.9%, a difference of 0.12%), and Samoan (11.9%, a difference of 0.23%).
| Demographics | Rating | Rank | Unemployment Among Youth under 25 years |
| Peruvians | 14.0 /100 | #205 | Poor 11.8% |
| Immigrants | Pakistan | 12.6 /100 | #206 | Poor 11.8% |
| Immigrants | Southern Europe | 12.3 /100 | #207 | Poor 11.8% |
| Comanche | 12.1 /100 | #208 | Poor 11.8% |
| Immigrants | Lebanon | 11.3 /100 | #209 | Poor 11.8% |
| Assyrians/Chaldeans/Syriacs | 9.8 /100 | #210 | Tragic 11.9% |
| Immigrants | Philippines | 9.2 /100 | #211 | Tragic 11.9% |
| Colombians | 9.1 /100 | #212 | Tragic 11.9% |
| South Americans | 8.5 /100 | #213 | Tragic 11.9% |
| Costa Ricans | 8.2 /100 | #214 | Tragic 11.9% |
| Samoans | 7.4 /100 | #215 | Tragic 11.9% |
| Guamanians/Chamorros | 7.0 /100 | #216 | Tragic 11.9% |
| Yaqui | 6.9 /100 | #217 | Tragic 11.9% |
| Immigrants | Middle Africa | 6.8 /100 | #218 | Tragic 11.9% |
| Immigrants | Nonimmigrants | 6.2 /100 | #219 | Tragic 11.9% |