Vietnamese vs Colombian Female Disability
COMPARE
Vietnamese
Colombian
Female Disability
Female Disability Comparison
Vietnamese
Colombians
11.6%
FEMALE DISABILITY
99.5/ 100
METRIC RATING
89th/ 347
METRIC RANK
11.5%
FEMALE DISABILITY
99.8/ 100
METRIC RATING
69th/ 347
METRIC RANK
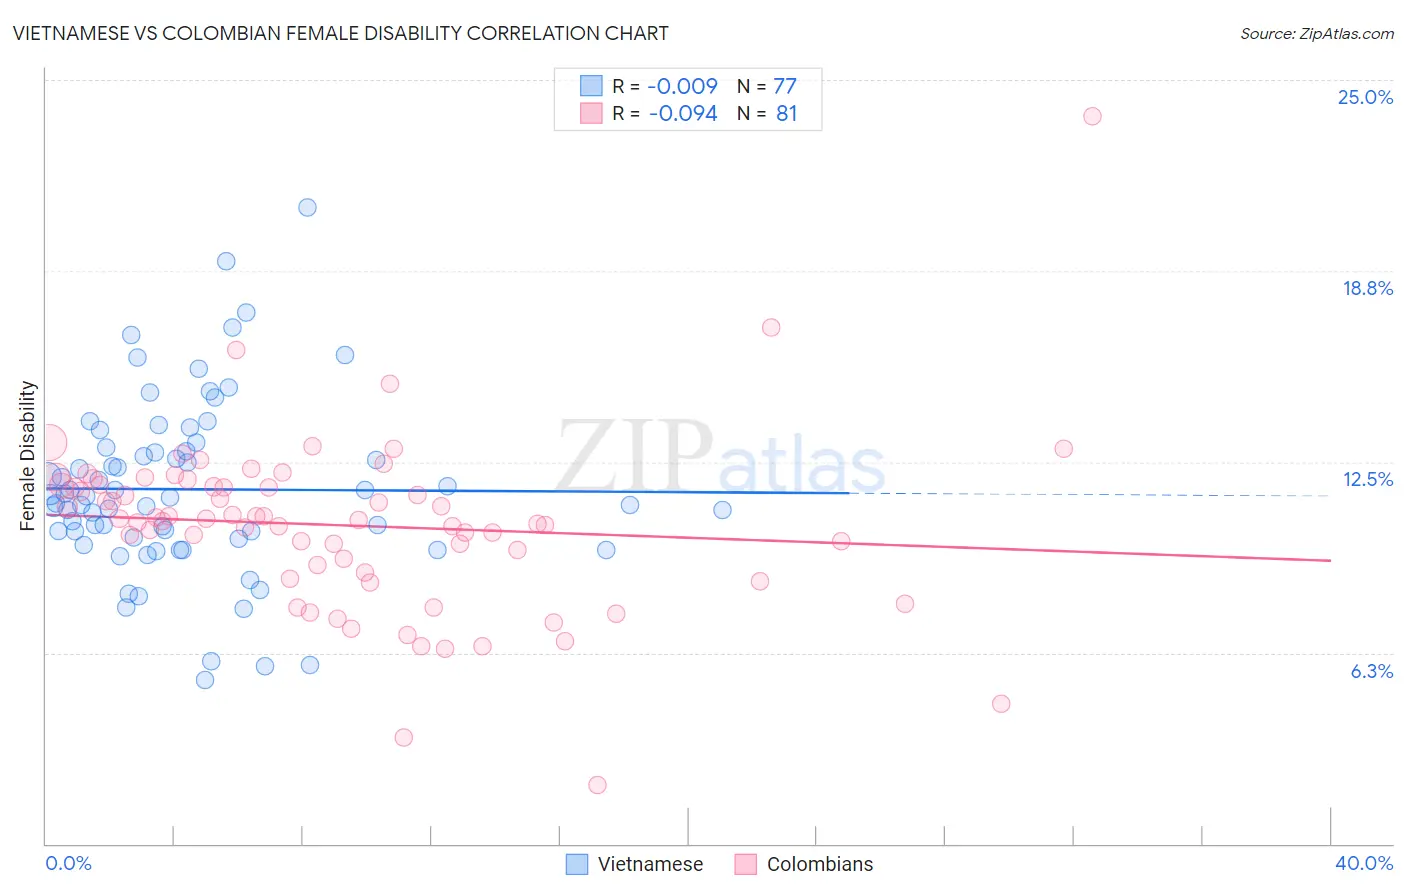
Vietnamese vs Colombian Female Disability Correlation Chart
The statistical analysis conducted on geographies consisting of 170,755,958 people shows no correlation between the proportion of Vietnamese and percentage of females with a disability in the United States with a correlation coefficient (R) of -0.009 and weighted average of 11.6%. Similarly, the statistical analysis conducted on geographies consisting of 419,587,687 people shows a slight negative correlation between the proportion of Colombians and percentage of females with a disability in the United States with a correlation coefficient (R) of -0.094 and weighted average of 11.5%, a difference of 1.0%.
Female Disability Correlation Summary
| Measurement | Vietnamese | Colombian |
| Minimum | 5.4% | 1.9% |
| Maximum | 20.8% | 23.8% |
| Range | 15.5% | 21.9% |
| Mean | 11.6% | 10.4% |
| Median | 11.3% | 10.6% |
| Interquartile 25% (IQ1) | 10.0% | 9.0% |
| Interquartile 75% (IQ3) | 12.9% | 11.7% |
| Interquartile Range (IQR) | 2.9% | 2.7% |
| Standard Deviation (Sample) | 2.9% | 2.9% |
| Standard Deviation (Population) | 2.8% | 2.9% |
Demographics Similar to Vietnamese and Colombians by Female Disability
In terms of female disability, the demographic groups most similar to Vietnamese are Immigrants from Denmark (11.6%, a difference of 0.10%), Yup'ik (11.6%, a difference of 0.10%), Immigrants from Cameroon (11.6%, a difference of 0.16%), Palestinian (11.6%, a difference of 0.17%), and Immigrants from Poland (11.6%, a difference of 0.20%). Similarly, the demographic groups most similar to Colombians are Immigrants from Chile (11.5%, a difference of 0.010%), Immigrants from Ireland (11.5%, a difference of 0.050%), Chilean (11.5%, a difference of 0.12%), Immigrants from Switzerland (11.5%, a difference of 0.14%), and Bhutanese (11.5%, a difference of 0.22%).
| Demographics | Rating | Rank | Female Disability |
| Colombians | 99.8 /100 | #69 | Exceptional 11.5% |
| Immigrants | Chile | 99.8 /100 | #70 | Exceptional 11.5% |
| Immigrants | Ireland | 99.8 /100 | #71 | Exceptional 11.5% |
| Chileans | 99.8 /100 | #72 | Exceptional 11.5% |
| Immigrants | Switzerland | 99.8 /100 | #73 | Exceptional 11.5% |
| Bhutanese | 99.8 /100 | #74 | Exceptional 11.5% |
| Immigrants | Lebanon | 99.7 /100 | #75 | Exceptional 11.5% |
| Immigrants | Eritrea | 99.7 /100 | #76 | Exceptional 11.5% |
| Immigrants | Afghanistan | 99.7 /100 | #77 | Exceptional 11.5% |
| Immigrants | South Africa | 99.7 /100 | #78 | Exceptional 11.5% |
| Sierra Leoneans | 99.7 /100 | #79 | Exceptional 11.5% |
| Immigrants | Jordan | 99.7 /100 | #80 | Exceptional 11.5% |
| Eastern Europeans | 99.7 /100 | #81 | Exceptional 11.5% |
| Luxembourgers | 99.6 /100 | #82 | Exceptional 11.6% |
| Immigrants | Serbia | 99.6 /100 | #83 | Exceptional 11.6% |
| Immigrants | Poland | 99.6 /100 | #84 | Exceptional 11.6% |
| Palestinians | 99.6 /100 | #85 | Exceptional 11.6% |
| Immigrants | Cameroon | 99.6 /100 | #86 | Exceptional 11.6% |
| Immigrants | Denmark | 99.5 /100 | #87 | Exceptional 11.6% |
| Yup'ik | 99.5 /100 | #88 | Exceptional 11.6% |
| Vietnamese | 99.5 /100 | #89 | Exceptional 11.6% |