Armenian vs Russian Cognitive Disability
COMPARE
Armenian
Russian
Cognitive Disability
Cognitive Disability Comparison
Armenians
Russians
17.2%
COGNITIVE DISABILITY
70.1/ 100
METRIC RATING
164th/ 347
METRIC RANK
16.4%
COGNITIVE DISABILITY
99.9/ 100
METRIC RATING
34th/ 347
METRIC RANK
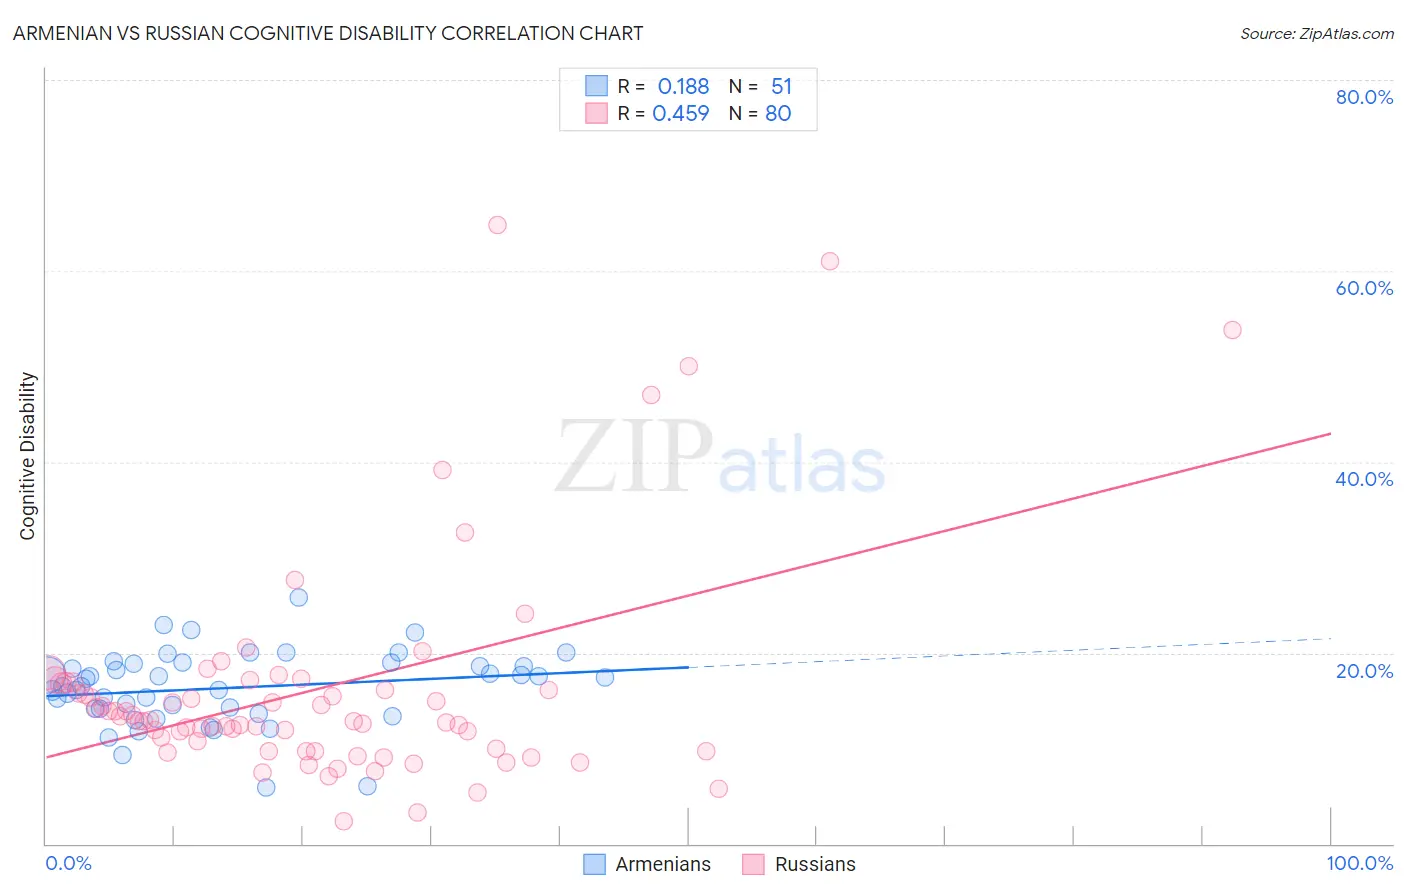
Armenian vs Russian Cognitive Disability Correlation Chart
The statistical analysis conducted on geographies consisting of 310,934,651 people shows a poor positive correlation between the proportion of Armenians and percentage of population with cognitive disability in the United States with a correlation coefficient (R) of 0.188 and weighted average of 17.2%. Similarly, the statistical analysis conducted on geographies consisting of 512,152,080 people shows a moderate positive correlation between the proportion of Russians and percentage of population with cognitive disability in the United States with a correlation coefficient (R) of 0.459 and weighted average of 16.4%, a difference of 4.6%.
Cognitive Disability Correlation Summary
| Measurement | Armenian | Russian |
| Minimum | 5.9% | 2.3% |
| Maximum | 25.7% | 64.9% |
| Range | 19.9% | 62.5% |
| Mean | 16.3% | 16.1% |
| Median | 16.5% | 12.9% |
| Interquartile 25% (IQ1) | 14.1% | 9.9% |
| Interquartile 75% (IQ3) | 18.8% | 16.8% |
| Interquartile Range (IQR) | 4.8% | 7.0% |
| Standard Deviation (Sample) | 3.9% | 11.7% |
| Standard Deviation (Population) | 3.9% | 11.6% |
Similar Demographics by Cognitive Disability
Demographics Similar to Armenians by Cognitive Disability
In terms of cognitive disability, the demographic groups most similar to Armenians are Yugoslavian (17.2%, a difference of 0.050%), Immigrants from Switzerland (17.2%, a difference of 0.050%), American (17.2%, a difference of 0.070%), Australian (17.2%, a difference of 0.080%), and Immigrants from Latvia (17.2%, a difference of 0.11%).
| Demographics | Rating | Rank | Cognitive Disability |
| Immigrants | Australia | 76.0 /100 | #157 | Good 17.1% |
| Celtics | 74.1 /100 | #158 | Good 17.1% |
| Immigrants | Latvia | 73.2 /100 | #159 | Good 17.2% |
| Australians | 72.4 /100 | #160 | Good 17.2% |
| Americans | 72.2 /100 | #161 | Good 17.2% |
| Yugoslavians | 71.6 /100 | #162 | Good 17.2% |
| Immigrants | Switzerland | 71.5 /100 | #163 | Good 17.2% |
| Armenians | 70.1 /100 | #164 | Good 17.2% |
| Immigrants | Albania | 64.9 /100 | #165 | Good 17.2% |
| Immigrants | Ecuador | 64.4 /100 | #166 | Good 17.2% |
| Immigrants | Syria | 63.5 /100 | #167 | Good 17.2% |
| Immigrants | Immigrants | 62.5 /100 | #168 | Good 17.2% |
| Immigrants | Portugal | 61.8 /100 | #169 | Good 17.2% |
| Ecuadorians | 59.6 /100 | #170 | Average 17.2% |
| Tlingit-Haida | 59.4 /100 | #171 | Average 17.2% |
Demographics Similar to Russians by Cognitive Disability
In terms of cognitive disability, the demographic groups most similar to Russians are Italian (16.4%, a difference of 0.0%), Immigrants from Israel (16.4%, a difference of 0.080%), Slovak (16.4%, a difference of 0.080%), Greek (16.4%, a difference of 0.090%), and Immigrants from Romania (16.4%, a difference of 0.13%).
| Demographics | Rating | Rank | Cognitive Disability |
| Immigrants | Pakistan | 99.9 /100 | #27 | Exceptional 16.4% |
| Poles | 99.9 /100 | #28 | Exceptional 16.4% |
| Filipinos | 99.9 /100 | #29 | Exceptional 16.4% |
| Czechs | 99.9 /100 | #30 | Exceptional 16.4% |
| Immigrants | Romania | 99.9 /100 | #31 | Exceptional 16.4% |
| Immigrants | Israel | 99.9 /100 | #32 | Exceptional 16.4% |
| Italians | 99.9 /100 | #33 | Exceptional 16.4% |
| Russians | 99.9 /100 | #34 | Exceptional 16.4% |
| Slovaks | 99.9 /100 | #35 | Exceptional 16.4% |
| Greeks | 99.9 /100 | #36 | Exceptional 16.4% |
| Slovenes | 99.9 /100 | #37 | Exceptional 16.5% |
| Immigrants | Eastern Europe | 99.9 /100 | #38 | Exceptional 16.5% |
| Bolivians | 99.9 /100 | #39 | Exceptional 16.5% |
| Immigrants | Belarus | 99.9 /100 | #40 | Exceptional 16.5% |
| Cubans | 99.9 /100 | #41 | Exceptional 16.5% |