Immigrants from Fiji vs Russian Cognitive Disability
COMPARE
Immigrants from Fiji
Russian
Cognitive Disability
Cognitive Disability Comparison
Immigrants from Fiji
Russians
17.4%
COGNITIVE DISABILITY
33.7/ 100
METRIC RATING
187th/ 347
METRIC RANK
16.4%
COGNITIVE DISABILITY
99.9/ 100
METRIC RATING
34th/ 347
METRIC RANK
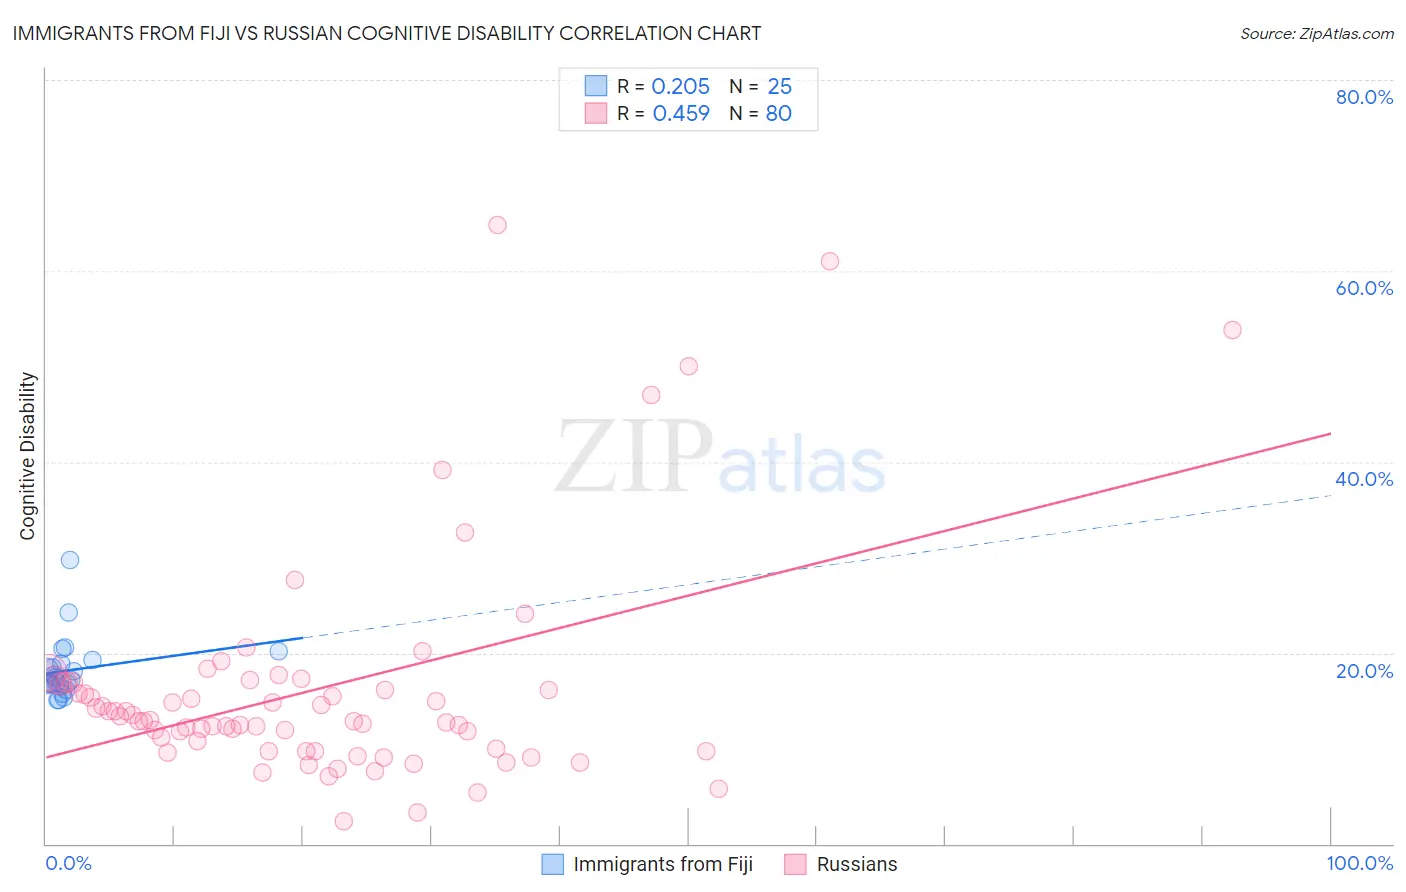
Immigrants from Fiji vs Russian Cognitive Disability Correlation Chart
The statistical analysis conducted on geographies consisting of 93,755,380 people shows a weak positive correlation between the proportion of Immigrants from Fiji and percentage of population with cognitive disability in the United States with a correlation coefficient (R) of 0.205 and weighted average of 17.4%. Similarly, the statistical analysis conducted on geographies consisting of 512,152,080 people shows a moderate positive correlation between the proportion of Russians and percentage of population with cognitive disability in the United States with a correlation coefficient (R) of 0.459 and weighted average of 16.4%, a difference of 5.8%.
Cognitive Disability Correlation Summary
| Measurement | Immigrants from Fiji | Russian |
| Minimum | 15.0% | 2.3% |
| Maximum | 29.7% | 64.9% |
| Range | 14.7% | 62.5% |
| Mean | 18.2% | 16.1% |
| Median | 17.1% | 12.9% |
| Interquartile 25% (IQ1) | 16.6% | 9.9% |
| Interquartile 75% (IQ3) | 19.0% | 16.8% |
| Interquartile Range (IQR) | 2.4% | 7.0% |
| Standard Deviation (Sample) | 3.2% | 11.7% |
| Standard Deviation (Population) | 3.1% | 11.6% |
Similar Demographics by Cognitive Disability
Demographics Similar to Immigrants from Fiji by Cognitive Disability
In terms of cognitive disability, the demographic groups most similar to Immigrants from Fiji are Cambodian (17.3%, a difference of 0.070%), Immigrants from France (17.4%, a difference of 0.13%), Afghan (17.3%, a difference of 0.14%), Immigrants from Western Asia (17.4%, a difference of 0.14%), and Crow (17.3%, a difference of 0.17%).
| Demographics | Rating | Rank | Cognitive Disability |
| Pakistanis | 43.9 /100 | #180 | Average 17.3% |
| Immigrants | Guyana | 42.9 /100 | #181 | Average 17.3% |
| Arabs | 42.8 /100 | #182 | Average 17.3% |
| Spaniards | 40.3 /100 | #183 | Average 17.3% |
| Crow | 39.1 /100 | #184 | Fair 17.3% |
| Afghans | 38.2 /100 | #185 | Fair 17.3% |
| Cambodians | 35.9 /100 | #186 | Fair 17.3% |
| Immigrants | Fiji | 33.7 /100 | #187 | Fair 17.4% |
| Immigrants | France | 29.8 /100 | #188 | Fair 17.4% |
| Immigrants | Western Asia | 29.5 /100 | #189 | Fair 17.4% |
| Immigrants | Spain | 27.7 /100 | #190 | Fair 17.4% |
| Immigrants | Nonimmigrants | 27.4 /100 | #191 | Fair 17.4% |
| Immigrants | Haiti | 27.1 /100 | #192 | Fair 17.4% |
| Delaware | 25.6 /100 | #193 | Fair 17.4% |
| Immigrants | Bosnia and Herzegovina | 22.0 /100 | #194 | Fair 17.4% |
Demographics Similar to Russians by Cognitive Disability
In terms of cognitive disability, the demographic groups most similar to Russians are Italian (16.4%, a difference of 0.0%), Immigrants from Israel (16.4%, a difference of 0.080%), Slovak (16.4%, a difference of 0.080%), Greek (16.4%, a difference of 0.090%), and Immigrants from Romania (16.4%, a difference of 0.13%).
| Demographics | Rating | Rank | Cognitive Disability |
| Immigrants | Pakistan | 99.9 /100 | #27 | Exceptional 16.4% |
| Poles | 99.9 /100 | #28 | Exceptional 16.4% |
| Filipinos | 99.9 /100 | #29 | Exceptional 16.4% |
| Czechs | 99.9 /100 | #30 | Exceptional 16.4% |
| Immigrants | Romania | 99.9 /100 | #31 | Exceptional 16.4% |
| Immigrants | Israel | 99.9 /100 | #32 | Exceptional 16.4% |
| Italians | 99.9 /100 | #33 | Exceptional 16.4% |
| Russians | 99.9 /100 | #34 | Exceptional 16.4% |
| Slovaks | 99.9 /100 | #35 | Exceptional 16.4% |
| Greeks | 99.9 /100 | #36 | Exceptional 16.4% |
| Slovenes | 99.9 /100 | #37 | Exceptional 16.5% |
| Immigrants | Eastern Europe | 99.9 /100 | #38 | Exceptional 16.5% |
| Bolivians | 99.9 /100 | #39 | Exceptional 16.5% |
| Immigrants | Belarus | 99.9 /100 | #40 | Exceptional 16.5% |
| Cubans | 99.9 /100 | #41 | Exceptional 16.5% |