German vs Russian Cognitive Disability
COMPARE
German
Russian
Cognitive Disability
Cognitive Disability Comparison
Germans
Russians
16.7%
COGNITIVE DISABILITY
99.3/ 100
METRIC RATING
72nd/ 347
METRIC RANK
16.4%
COGNITIVE DISABILITY
99.9/ 100
METRIC RATING
34th/ 347
METRIC RANK
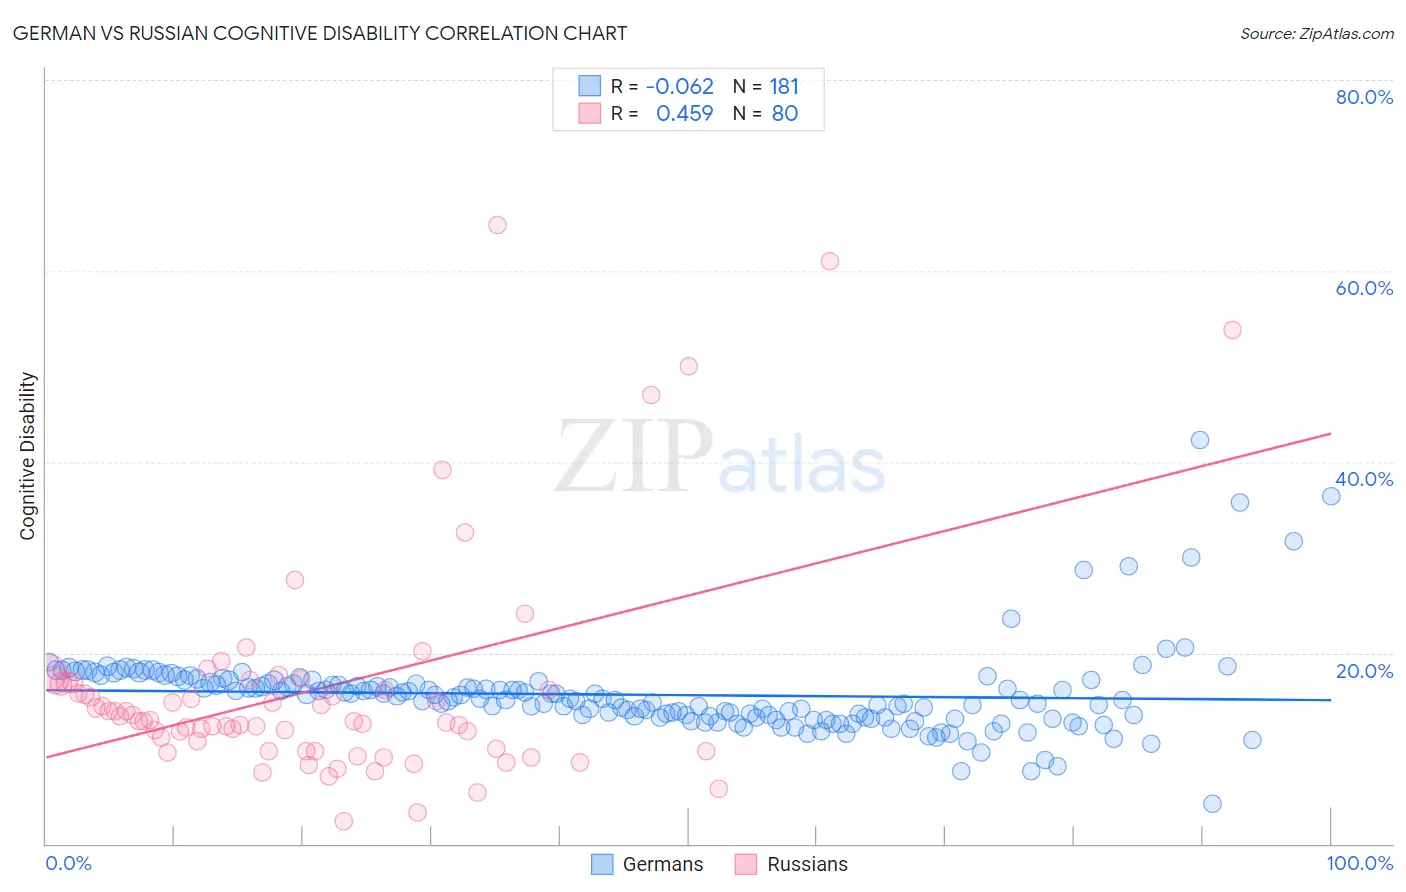
German vs Russian Cognitive Disability Correlation Chart
The statistical analysis conducted on geographies consisting of 580,999,229 people shows a slight negative correlation between the proportion of Germans and percentage of population with cognitive disability in the United States with a correlation coefficient (R) of -0.062 and weighted average of 16.7%. Similarly, the statistical analysis conducted on geographies consisting of 512,152,080 people shows a moderate positive correlation between the proportion of Russians and percentage of population with cognitive disability in the United States with a correlation coefficient (R) of 0.459 and weighted average of 16.4%, a difference of 1.5%.
Cognitive Disability Correlation Summary
| Measurement | German | Russian |
| Minimum | 4.2% | 2.3% |
| Maximum | 42.3% | 64.9% |
| Range | 38.1% | 62.5% |
| Mean | 15.6% | 16.1% |
| Median | 15.2% | 12.9% |
| Interquartile 25% (IQ1) | 13.3% | 9.9% |
| Interquartile 75% (IQ3) | 16.9% | 16.8% |
| Interquartile Range (IQR) | 3.7% | 7.0% |
| Standard Deviation (Sample) | 4.5% | 11.7% |
| Standard Deviation (Population) | 4.5% | 11.6% |
Similar Demographics by Cognitive Disability
Demographics Similar to Germans by Cognitive Disability
In terms of cognitive disability, the demographic groups most similar to Germans are Burmese (16.7%, a difference of 0.010%), Slavic (16.7%, a difference of 0.010%), Immigrants from Sweden (16.7%, a difference of 0.020%), Immigrants from Belgium (16.7%, a difference of 0.020%), and Estonian (16.7%, a difference of 0.020%).
| Demographics | Rating | Rank | Cognitive Disability |
| Colombians | 99.6 /100 | #65 | Exceptional 16.6% |
| Immigrants | Ukraine | 99.5 /100 | #66 | Exceptional 16.6% |
| Latvians | 99.5 /100 | #67 | Exceptional 16.6% |
| Ukrainians | 99.4 /100 | #68 | Exceptional 16.6% |
| Immigrants | Uzbekistan | 99.4 /100 | #69 | Exceptional 16.7% |
| Immigrants | Sweden | 99.4 /100 | #70 | Exceptional 16.7% |
| Immigrants | Belgium | 99.3 /100 | #71 | Exceptional 16.7% |
| Germans | 99.3 /100 | #72 | Exceptional 16.7% |
| Burmese | 99.3 /100 | #73 | Exceptional 16.7% |
| Slavs | 99.3 /100 | #74 | Exceptional 16.7% |
| Estonians | 99.3 /100 | #75 | Exceptional 16.7% |
| Immigrants | Serbia | 99.3 /100 | #76 | Exceptional 16.7% |
| Immigrants | Hungary | 99.3 /100 | #77 | Exceptional 16.7% |
| Peruvians | 99.3 /100 | #78 | Exceptional 16.7% |
| Immigrants | Bulgaria | 99.3 /100 | #79 | Exceptional 16.7% |
Demographics Similar to Russians by Cognitive Disability
In terms of cognitive disability, the demographic groups most similar to Russians are Italian (16.4%, a difference of 0.0%), Immigrants from Israel (16.4%, a difference of 0.080%), Slovak (16.4%, a difference of 0.080%), Greek (16.4%, a difference of 0.090%), and Immigrants from Romania (16.4%, a difference of 0.13%).
| Demographics | Rating | Rank | Cognitive Disability |
| Immigrants | Pakistan | 99.9 /100 | #27 | Exceptional 16.4% |
| Poles | 99.9 /100 | #28 | Exceptional 16.4% |
| Filipinos | 99.9 /100 | #29 | Exceptional 16.4% |
| Czechs | 99.9 /100 | #30 | Exceptional 16.4% |
| Immigrants | Romania | 99.9 /100 | #31 | Exceptional 16.4% |
| Immigrants | Israel | 99.9 /100 | #32 | Exceptional 16.4% |
| Italians | 99.9 /100 | #33 | Exceptional 16.4% |
| Russians | 99.9 /100 | #34 | Exceptional 16.4% |
| Slovaks | 99.9 /100 | #35 | Exceptional 16.4% |
| Greeks | 99.9 /100 | #36 | Exceptional 16.4% |
| Slovenes | 99.9 /100 | #37 | Exceptional 16.5% |
| Immigrants | Eastern Europe | 99.9 /100 | #38 | Exceptional 16.5% |
| Bolivians | 99.9 /100 | #39 | Exceptional 16.5% |
| Immigrants | Belarus | 99.9 /100 | #40 | Exceptional 16.5% |
| Cubans | 99.9 /100 | #41 | Exceptional 16.5% |