Immigrants from China vs Moroccan Ambulatory Disability
COMPARE
Immigrants from China
Moroccan
Ambulatory Disability
Ambulatory Disability Comparison
Immigrants from China
Moroccans
5.3%
AMBULATORY DISABILITY
100.0/ 100
METRIC RATING
15th/ 347
METRIC RANK
6.1%
AMBULATORY DISABILITY
52.6/ 100
METRIC RATING
171st/ 347
METRIC RANK
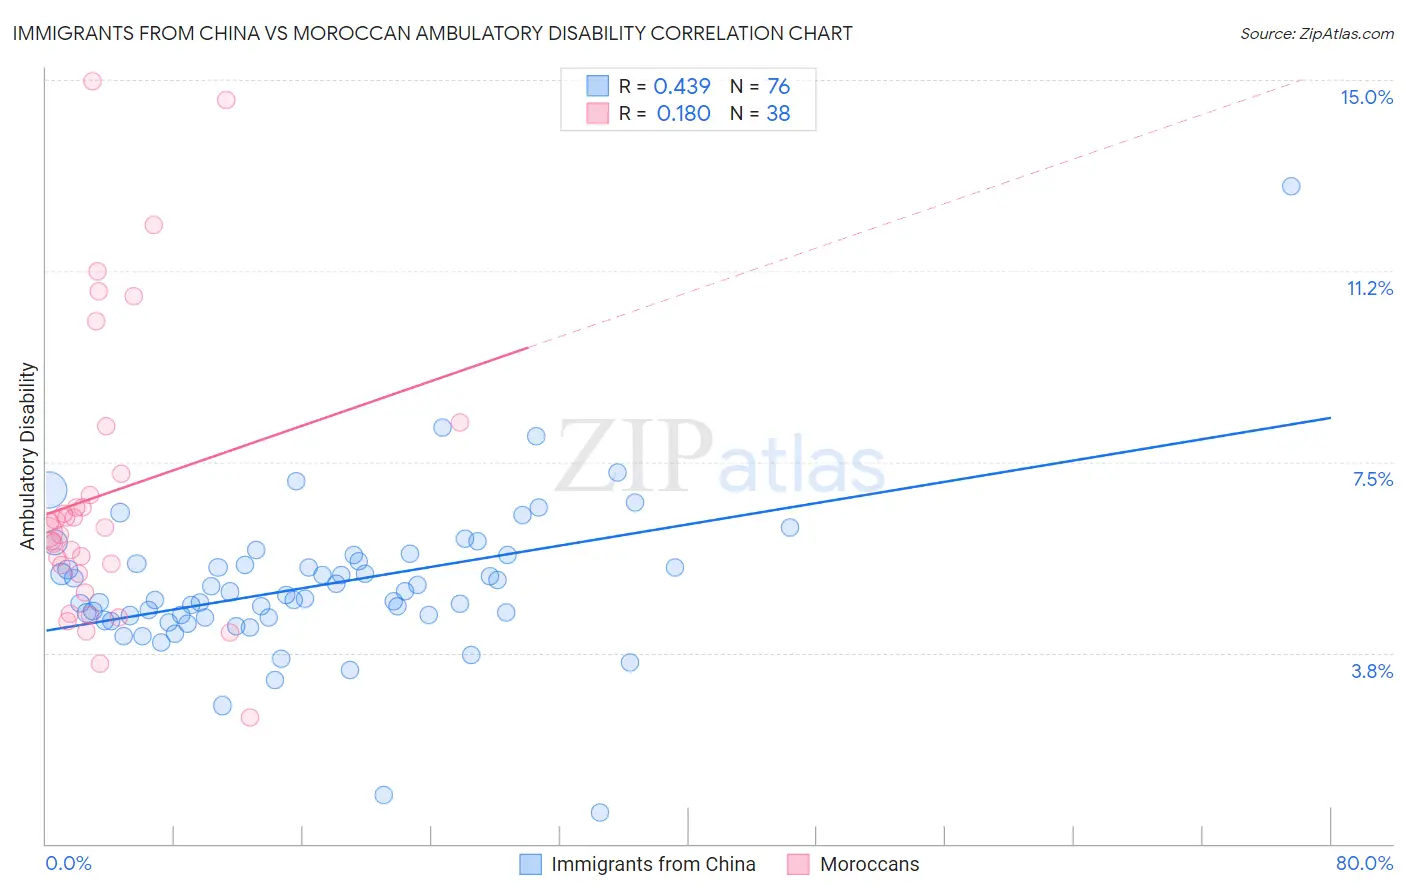
Immigrants from China vs Moroccan Ambulatory Disability Correlation Chart
The statistical analysis conducted on geographies consisting of 456,848,702 people shows a moderate positive correlation between the proportion of Immigrants from China and percentage of population with ambulatory disability in the United States with a correlation coefficient (R) of 0.439 and weighted average of 5.3%. Similarly, the statistical analysis conducted on geographies consisting of 201,789,132 people shows a poor positive correlation between the proportion of Moroccans and percentage of population with ambulatory disability in the United States with a correlation coefficient (R) of 0.180 and weighted average of 6.1%, a difference of 15.1%.
Ambulatory Disability Correlation Summary
| Measurement | Immigrants from China | Moroccan |
| Minimum | 0.61% | 2.5% |
| Maximum | 12.9% | 15.0% |
| Range | 12.3% | 12.5% |
| Mean | 5.1% | 6.9% |
| Median | 4.8% | 6.2% |
| Interquartile 25% (IQ1) | 4.4% | 5.3% |
| Interquartile 75% (IQ3) | 5.5% | 7.3% |
| Interquartile Range (IQR) | 1.1% | 2.0% |
| Standard Deviation (Sample) | 1.5% | 2.9% |
| Standard Deviation (Population) | 1.5% | 2.8% |
Similar Demographics by Ambulatory Disability
Demographics Similar to Immigrants from China by Ambulatory Disability
In terms of ambulatory disability, the demographic groups most similar to Immigrants from China are Immigrants from Eastern Asia (5.3%, a difference of 0.33%), Burmese (5.3%, a difference of 0.48%), Immigrants from Hong Kong (5.3%, a difference of 0.54%), Immigrants from Ethiopia (5.4%, a difference of 0.88%), and Immigrants from Sri Lanka (5.4%, a difference of 0.88%).
| Demographics | Rating | Rank | Ambulatory Disability |
| Immigrants | South Central Asia | 100.0 /100 | #8 | Exceptional 5.1% |
| Iranians | 100.0 /100 | #9 | Exceptional 5.1% |
| Yup'ik | 100.0 /100 | #10 | Exceptional 5.2% |
| Immigrants | Korea | 100.0 /100 | #11 | Exceptional 5.2% |
| Okinawans | 100.0 /100 | #12 | Exceptional 5.3% |
| Burmese | 100.0 /100 | #13 | Exceptional 5.3% |
| Immigrants | Eastern Asia | 100.0 /100 | #14 | Exceptional 5.3% |
| Immigrants | China | 100.0 /100 | #15 | Exceptional 5.3% |
| Immigrants | Hong Kong | 100.0 /100 | #16 | Exceptional 5.3% |
| Immigrants | Ethiopia | 100.0 /100 | #17 | Exceptional 5.4% |
| Immigrants | Sri Lanka | 100.0 /100 | #18 | Exceptional 5.4% |
| Indians (Asian) | 100.0 /100 | #19 | Exceptional 5.4% |
| Ethiopians | 100.0 /100 | #20 | Exceptional 5.4% |
| Immigrants | Kuwait | 100.0 /100 | #21 | Exceptional 5.4% |
| Immigrants | Israel | 100.0 /100 | #22 | Exceptional 5.4% |
Demographics Similar to Moroccans by Ambulatory Disability
In terms of ambulatory disability, the demographic groups most similar to Moroccans are Immigrants from Burma/Myanmar (6.1%, a difference of 0.020%), Immigrants from Ecuador (6.1%, a difference of 0.070%), Croatian (6.1%, a difference of 0.080%), Immigrants from Canada (6.1%, a difference of 0.14%), and Immigrants from Southern Europe (6.1%, a difference of 0.29%).
| Demographics | Rating | Rank | Ambulatory Disability |
| Basques | 63.7 /100 | #164 | Good 6.1% |
| Nicaraguans | 63.2 /100 | #165 | Good 6.1% |
| Iraqis | 62.8 /100 | #166 | Good 6.1% |
| Immigrants | Oceania | 60.7 /100 | #167 | Good 6.1% |
| Ecuadorians | 60.5 /100 | #168 | Good 6.1% |
| Immigrants | Southern Europe | 58.1 /100 | #169 | Average 6.1% |
| Immigrants | Ecuador | 53.8 /100 | #170 | Average 6.1% |
| Moroccans | 52.6 /100 | #171 | Average 6.1% |
| Immigrants | Burma/Myanmar | 52.2 /100 | #172 | Average 6.1% |
| Croatians | 51.2 /100 | #173 | Average 6.1% |
| Immigrants | Canada | 50.0 /100 | #174 | Average 6.1% |
| Vietnamese | 47.2 /100 | #175 | Average 6.1% |
| Immigrants | North America | 45.6 /100 | #176 | Average 6.1% |
| Immigrants | England | 45.4 /100 | #177 | Average 6.1% |
| Scandinavians | 44.5 /100 | #178 | Average 6.1% |