Polish vs Immigrants from Lithuania In Labor Force | Age 25-29
COMPARE
Polish
Immigrants from Lithuania
In Labor Force | Age 25-29
In Labor Force | Age 25-29 Comparison
Poles
Immigrants from Lithuania
85.8%
IN LABOR FORCE | AGE 25-29
99.9/ 100
METRIC RATING
37th/ 347
METRIC RANK
86.1%
IN LABOR FORCE | AGE 25-29
100.0/ 100
METRIC RATING
12th/ 347
METRIC RANK
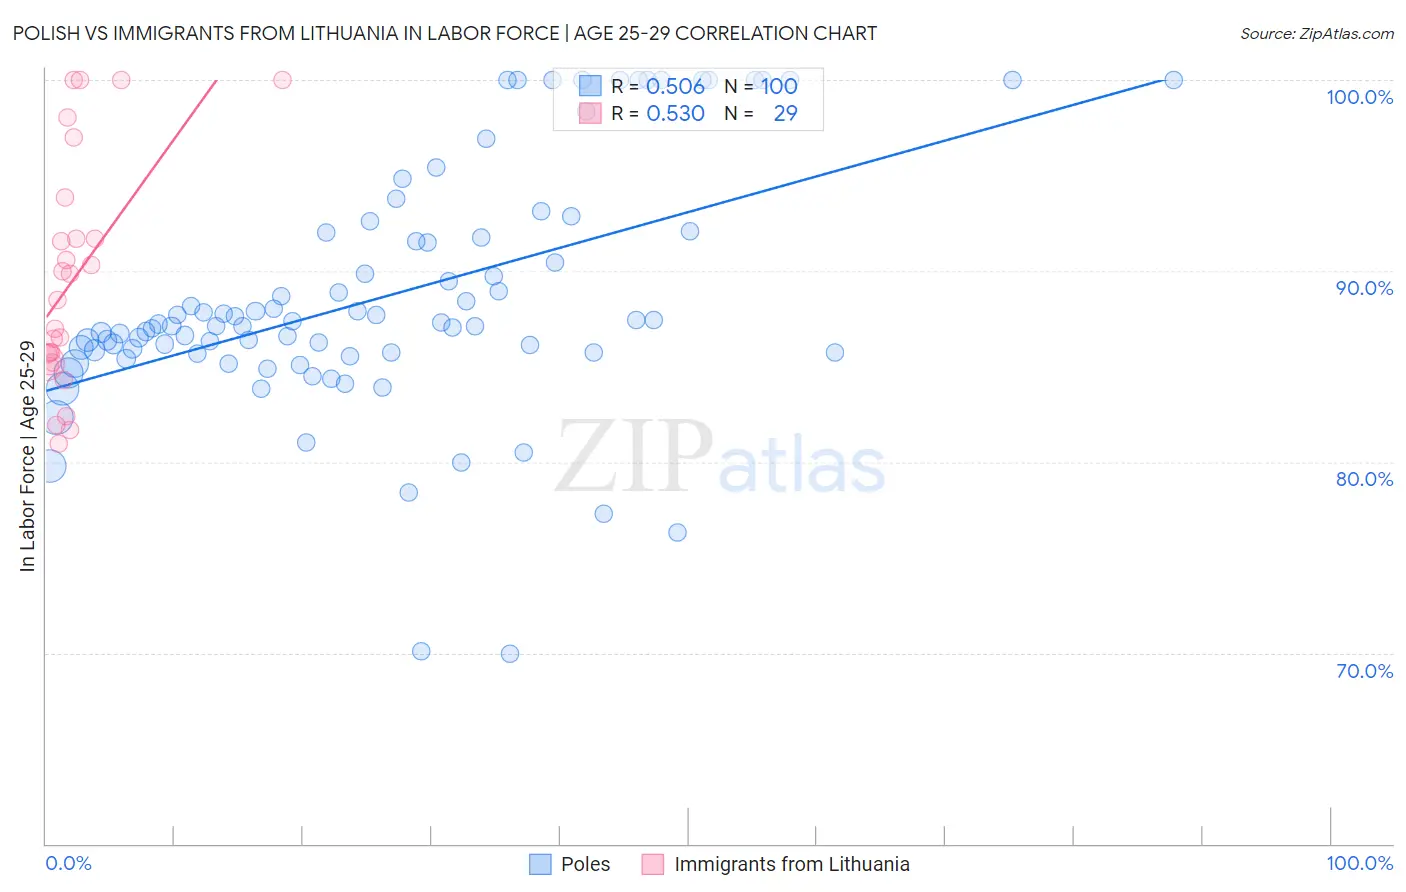
Polish vs Immigrants from Lithuania In Labor Force | Age 25-29 Correlation Chart
The statistical analysis conducted on geographies consisting of 559,462,142 people shows a substantial positive correlation between the proportion of Poles and labor force participation rate among population between the ages 25 and 29 in the United States with a correlation coefficient (R) of 0.506 and weighted average of 85.8%. Similarly, the statistical analysis conducted on geographies consisting of 117,715,877 people shows a substantial positive correlation between the proportion of Immigrants from Lithuania and labor force participation rate among population between the ages 25 and 29 in the United States with a correlation coefficient (R) of 0.530 and weighted average of 86.1%, a difference of 0.40%.
In Labor Force | Age 25-29 Correlation Summary
| Measurement | Polish | Immigrants from Lithuania |
| Minimum | 69.9% | 81.0% |
| Maximum | 100.0% | 100.0% |
| Range | 30.1% | 19.0% |
| Mean | 88.7% | 89.5% |
| Median | 87.2% | 88.5% |
| Interquartile 25% (IQ1) | 85.7% | 85.2% |
| Interquartile 75% (IQ3) | 91.9% | 92.8% |
| Interquartile Range (IQR) | 6.2% | 7.6% |
| Standard Deviation (Sample) | 6.4% | 6.0% |
| Standard Deviation (Population) | 6.4% | 5.9% |
Similar Demographics by In Labor Force | Age 25-29
Demographics Similar to Poles by In Labor Force | Age 25-29
In terms of in labor force | age 25-29, the demographic groups most similar to Poles are Sierra Leonean (85.8%, a difference of 0.020%), Cypriot (85.8%, a difference of 0.030%), Immigrants from Nepal (85.8%, a difference of 0.030%), Croatian (85.8%, a difference of 0.030%), and Lithuanian (85.8%, a difference of 0.040%).
| Demographics | Rating | Rank | In Labor Force | Age 25-29 |
| Immigrants | Serbia | 100.0 /100 | #30 | Exceptional 85.9% |
| German Russians | 100.0 /100 | #31 | Exceptional 85.8% |
| Slovaks | 100.0 /100 | #32 | Exceptional 85.8% |
| Immigrants | Bulgaria | 100.0 /100 | #33 | Exceptional 85.8% |
| Lithuanians | 99.9 /100 | #34 | Exceptional 85.8% |
| Cypriots | 99.9 /100 | #35 | Exceptional 85.8% |
| Immigrants | Nepal | 99.9 /100 | #36 | Exceptional 85.8% |
| Poles | 99.9 /100 | #37 | Exceptional 85.8% |
| Sierra Leoneans | 99.9 /100 | #38 | Exceptional 85.8% |
| Croatians | 99.9 /100 | #39 | Exceptional 85.8% |
| Immigrants | Albania | 99.9 /100 | #40 | Exceptional 85.7% |
| Immigrants | Greece | 99.9 /100 | #41 | Exceptional 85.7% |
| Immigrants | Eritrea | 99.9 /100 | #42 | Exceptional 85.7% |
| Immigrants | India | 99.9 /100 | #43 | Exceptional 85.7% |
| Macedonians | 99.9 /100 | #44 | Exceptional 85.7% |
Demographics Similar to Immigrants from Lithuania by In Labor Force | Age 25-29
In terms of in labor force | age 25-29, the demographic groups most similar to Immigrants from Lithuania are Liberian (86.1%, a difference of 0.010%), Immigrants from Ethiopia (86.1%, a difference of 0.010%), Norwegian (86.1%, a difference of 0.010%), Latvian (86.1%, a difference of 0.040%), and Bolivian (86.1%, a difference of 0.040%).
| Demographics | Rating | Rank | In Labor Force | Age 25-29 |
| Luxembourgers | 100.0 /100 | #5 | Exceptional 86.9% |
| Slovenes | 100.0 /100 | #6 | Exceptional 86.4% |
| Immigrants | Bosnia and Herzegovina | 100.0 /100 | #7 | Exceptional 86.3% |
| Immigrants | Cabo Verde | 100.0 /100 | #8 | Exceptional 86.2% |
| Ethiopians | 100.0 /100 | #9 | Exceptional 86.2% |
| Liberians | 100.0 /100 | #10 | Exceptional 86.1% |
| Immigrants | Ethiopia | 100.0 /100 | #11 | Exceptional 86.1% |
| Immigrants | Lithuania | 100.0 /100 | #12 | Exceptional 86.1% |
| Norwegians | 100.0 /100 | #13 | Exceptional 86.1% |
| Latvians | 100.0 /100 | #14 | Exceptional 86.1% |
| Bolivians | 100.0 /100 | #15 | Exceptional 86.1% |
| Immigrants | Bolivia | 100.0 /100 | #16 | Exceptional 86.1% |
| Bermudans | 100.0 /100 | #17 | Exceptional 86.0% |
| Bulgarians | 100.0 /100 | #18 | Exceptional 86.0% |
| Cape Verdeans | 100.0 /100 | #19 | Exceptional 86.0% |