South American vs Immigrants from Eastern Europe Ambulatory Disability
COMPARE
South American
Immigrants from Eastern Europe
Ambulatory Disability
Ambulatory Disability Comparison
South Americans
Immigrants from Eastern Europe
5.7%
AMBULATORY DISABILITY
99.0/ 100
METRIC RATING
85th/ 347
METRIC RANK
6.0%
AMBULATORY DISABILITY
82.0/ 100
METRIC RATING
148th/ 347
METRIC RANK
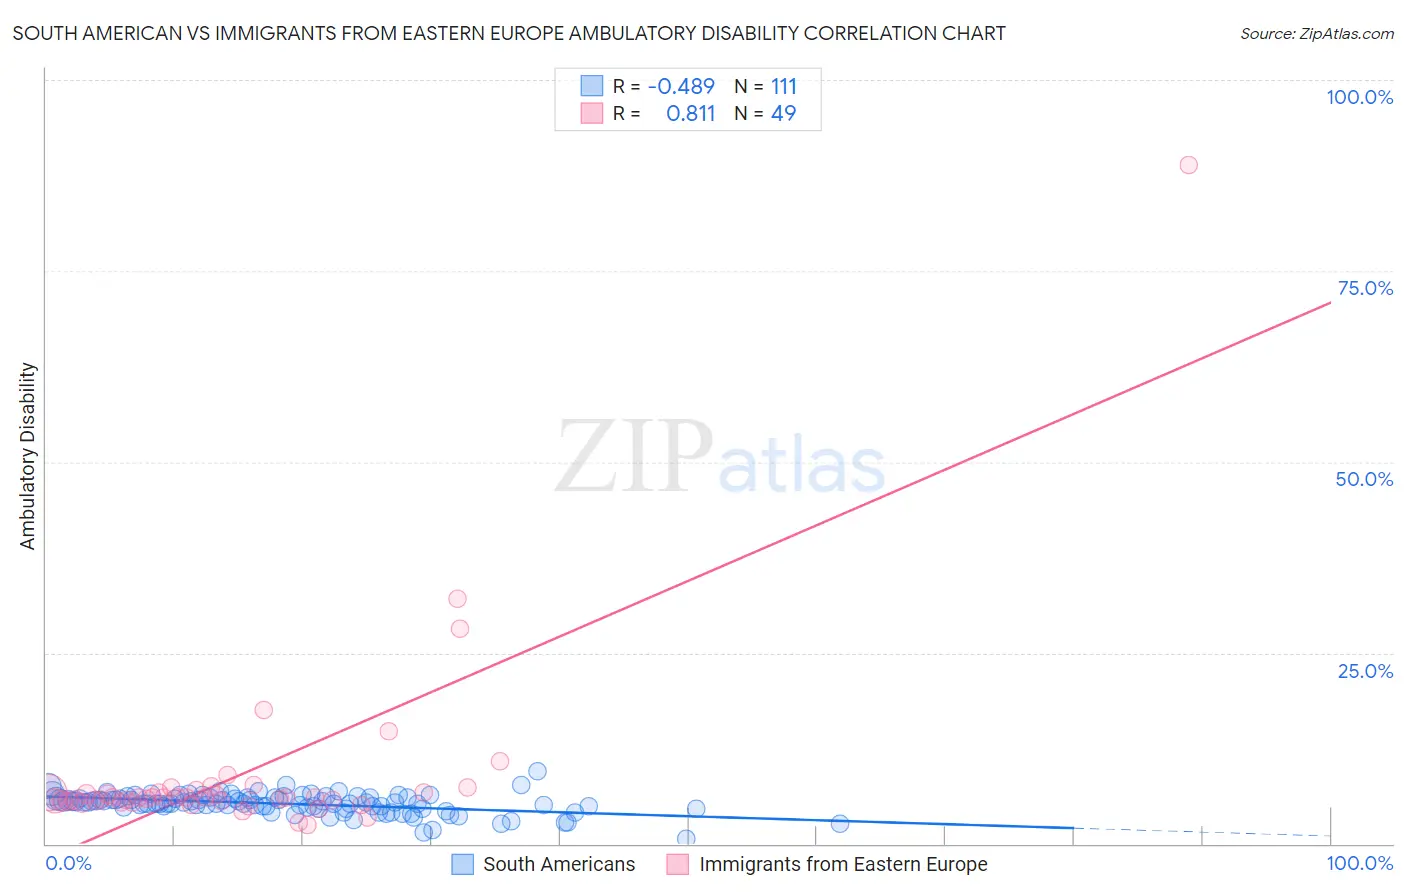
South American vs Immigrants from Eastern Europe Ambulatory Disability Correlation Chart
The statistical analysis conducted on geographies consisting of 493,855,959 people shows a moderate negative correlation between the proportion of South Americans and percentage of population with ambulatory disability in the United States with a correlation coefficient (R) of -0.489 and weighted average of 5.7%. Similarly, the statistical analysis conducted on geographies consisting of 475,636,404 people shows a very strong positive correlation between the proportion of Immigrants from Eastern Europe and percentage of population with ambulatory disability in the United States with a correlation coefficient (R) of 0.811 and weighted average of 6.0%, a difference of 4.3%.
Ambulatory Disability Correlation Summary
| Measurement | South American | Immigrants from Eastern Europe |
| Minimum | 0.63% | 2.4% |
| Maximum | 9.5% | 88.9% |
| Range | 8.9% | 86.4% |
| Mean | 5.2% | 9.1% |
| Median | 5.3% | 6.0% |
| Interquartile 25% (IQ1) | 4.7% | 5.6% |
| Interquartile 75% (IQ3) | 6.0% | 6.9% |
| Interquartile Range (IQR) | 1.3% | 1.3% |
| Standard Deviation (Sample) | 1.3% | 12.8% |
| Standard Deviation (Population) | 1.3% | 12.7% |
Similar Demographics by Ambulatory Disability
Demographics Similar to South Americans by Ambulatory Disability
In terms of ambulatory disability, the demographic groups most similar to South Americans are Latvian (5.7%, a difference of 0.030%), Immigrants from Chile (5.8%, a difference of 0.090%), Soviet Union (5.8%, a difference of 0.14%), Eastern European (5.7%, a difference of 0.24%), and Ugandan (5.7%, a difference of 0.24%).
| Demographics | Rating | Rank | Ambulatory Disability |
| Somalis | 99.2 /100 | #78 | Exceptional 5.7% |
| Chileans | 99.2 /100 | #79 | Exceptional 5.7% |
| Immigrants | Ireland | 99.2 /100 | #80 | Exceptional 5.7% |
| Immigrants | Jordan | 99.2 /100 | #81 | Exceptional 5.7% |
| Palestinians | 99.2 /100 | #82 | Exceptional 5.7% |
| Eastern Europeans | 99.2 /100 | #83 | Exceptional 5.7% |
| Ugandans | 99.2 /100 | #84 | Exceptional 5.7% |
| South Americans | 99.0 /100 | #85 | Exceptional 5.7% |
| Latvians | 99.0 /100 | #86 | Exceptional 5.7% |
| Immigrants | Chile | 98.9 /100 | #87 | Exceptional 5.8% |
| Soviet Union | 98.9 /100 | #88 | Exceptional 5.8% |
| Bhutanese | 98.8 /100 | #89 | Exceptional 5.8% |
| Australians | 98.8 /100 | #90 | Exceptional 5.8% |
| Immigrants | Sudan | 98.8 /100 | #91 | Exceptional 5.8% |
| Immigrants | Sierra Leone | 98.6 /100 | #92 | Exceptional 5.8% |
Demographics Similar to Immigrants from Eastern Europe by Ambulatory Disability
In terms of ambulatory disability, the demographic groups most similar to Immigrants from Eastern Europe are Lithuanian (6.0%, a difference of 0.010%), Maltese (6.0%, a difference of 0.030%), Immigrants from Moldova (6.0%, a difference of 0.040%), Pakistani (6.0%, a difference of 0.050%), and Immigrants from Greece (6.0%, a difference of 0.050%).
| Demographics | Rating | Rank | Ambulatory Disability |
| Swedes | 83.1 /100 | #141 | Excellent 6.0% |
| Immigrants | Philippines | 83.0 /100 | #142 | Excellent 6.0% |
| Romanians | 82.9 /100 | #143 | Excellent 6.0% |
| Macedonians | 82.8 /100 | #144 | Excellent 6.0% |
| Pakistanis | 82.5 /100 | #145 | Excellent 6.0% |
| Immigrants | Greece | 82.5 /100 | #146 | Excellent 6.0% |
| Immigrants | Moldova | 82.4 /100 | #147 | Excellent 6.0% |
| Immigrants | Eastern Europe | 82.0 /100 | #148 | Excellent 6.0% |
| Lithuanians | 81.9 /100 | #149 | Excellent 6.0% |
| Maltese | 81.6 /100 | #150 | Excellent 6.0% |
| Greeks | 79.6 /100 | #151 | Good 6.0% |
| Immigrants | Austria | 78.8 /100 | #152 | Good 6.0% |
| Syrians | 75.5 /100 | #153 | Good 6.0% |
| Immigrants | Croatia | 75.1 /100 | #154 | Good 6.0% |
| Immigrants | Scotland | 72.1 /100 | #155 | Good 6.0% |