Polish vs Immigrants from Middle Africa Vision Disability
COMPARE
Polish
Immigrants from Middle Africa
Vision Disability
Vision Disability Comparison
Poles
Immigrants from Middle Africa
2.1%
VISION DISABILITY
92.0/ 100
METRIC RATING
117th/ 347
METRIC RANK
2.2%
VISION DISABILITY
33.5/ 100
METRIC RATING
185th/ 347
METRIC RANK
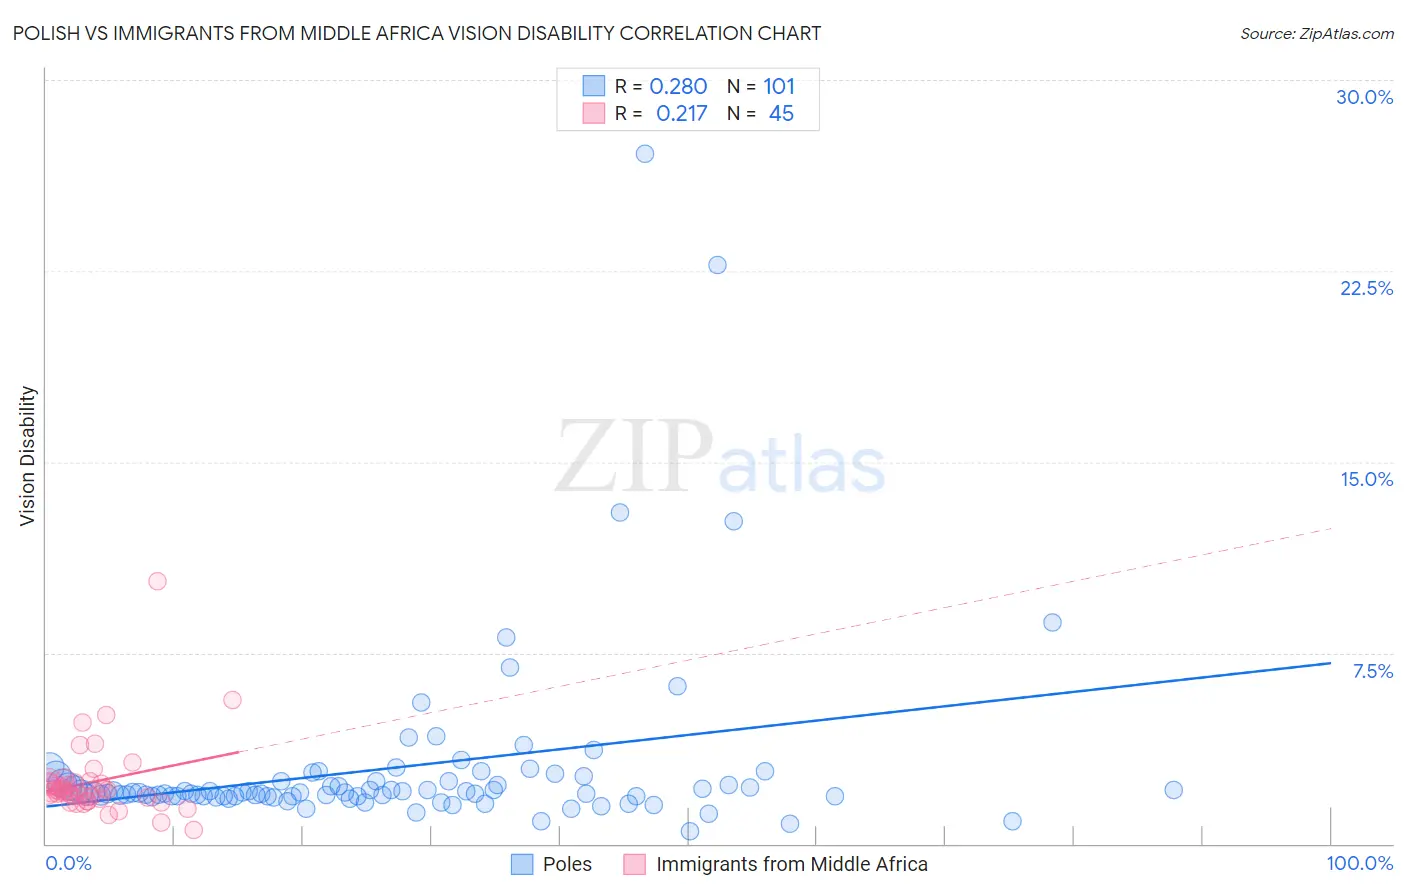
Polish vs Immigrants from Middle Africa Vision Disability Correlation Chart
The statistical analysis conducted on geographies consisting of 558,655,799 people shows a weak positive correlation between the proportion of Poles and percentage of population with vision disability in the United States with a correlation coefficient (R) of 0.280 and weighted average of 2.1%. Similarly, the statistical analysis conducted on geographies consisting of 202,642,272 people shows a weak positive correlation between the proportion of Immigrants from Middle Africa and percentage of population with vision disability in the United States with a correlation coefficient (R) of 0.217 and weighted average of 2.2%, a difference of 5.1%.
Vision Disability Correlation Summary
| Measurement | Polish | Immigrants from Middle Africa |
| Minimum | 0.47% | 0.56% |
| Maximum | 27.1% | 10.3% |
| Range | 26.7% | 9.7% |
| Mean | 3.0% | 2.4% |
| Median | 2.0% | 2.1% |
| Interquartile 25% (IQ1) | 1.9% | 1.7% |
| Interquartile 75% (IQ3) | 2.5% | 2.4% |
| Interquartile Range (IQR) | 0.60% | 0.66% |
| Standard Deviation (Sample) | 3.7% | 1.6% |
| Standard Deviation (Population) | 3.7% | 1.5% |
Similar Demographics by Vision Disability
Demographics Similar to Poles by Vision Disability
In terms of vision disability, the demographic groups most similar to Poles are Ugandan (2.1%, a difference of 0.040%), Immigrants from Vietnam (2.1%, a difference of 0.050%), Croatian (2.1%, a difference of 0.070%), Kenyan (2.1%, a difference of 0.11%), and Immigrants from Philippines (2.1%, a difference of 0.13%).
| Demographics | Rating | Rank | Vision Disability |
| Immigrants | Armenia | 93.8 /100 | #110 | Exceptional 2.1% |
| Peruvians | 93.5 /100 | #111 | Exceptional 2.1% |
| Immigrants | Denmark | 92.9 /100 | #112 | Exceptional 2.1% |
| Kenyans | 92.5 /100 | #113 | Exceptional 2.1% |
| Croatians | 92.3 /100 | #114 | Exceptional 2.1% |
| Immigrants | Vietnam | 92.2 /100 | #115 | Exceptional 2.1% |
| Ugandans | 92.2 /100 | #116 | Exceptional 2.1% |
| Poles | 92.0 /100 | #117 | Exceptional 2.1% |
| Immigrants | Philippines | 91.4 /100 | #118 | Exceptional 2.1% |
| Immigrants | Uganda | 91.4 /100 | #119 | Exceptional 2.1% |
| Immigrants | Zimbabwe | 91.0 /100 | #120 | Exceptional 2.1% |
| Immigrants | Scotland | 90.4 /100 | #121 | Exceptional 2.1% |
| Immigrants | Ukraine | 90.4 /100 | #122 | Exceptional 2.1% |
| Immigrants | Albania | 90.4 /100 | #123 | Exceptional 2.1% |
| Immigrants | Spain | 89.8 /100 | #124 | Excellent 2.1% |
Demographics Similar to Immigrants from Middle Africa by Vision Disability
In terms of vision disability, the demographic groups most similar to Immigrants from Middle Africa are Native Hawaiian (2.2%, a difference of 0.020%), Moroccan (2.2%, a difference of 0.13%), Immigrants from St. Vincent and the Grenadines (2.2%, a difference of 0.23%), Immigrants from Burma/Myanmar (2.2%, a difference of 0.30%), and Guyanese (2.2%, a difference of 0.34%).
| Demographics | Rating | Rank | Vision Disability |
| Immigrants | Oceania | 45.1 /100 | #178 | Average 2.2% |
| Immigrants | North America | 44.5 /100 | #179 | Average 2.2% |
| Uruguayans | 42.7 /100 | #180 | Average 2.2% |
| Immigrants | Western Europe | 41.1 /100 | #181 | Average 2.2% |
| Costa Ricans | 40.7 /100 | #182 | Average 2.2% |
| Immigrants | Burma/Myanmar | 37.9 /100 | #183 | Fair 2.2% |
| Moroccans | 35.4 /100 | #184 | Fair 2.2% |
| Immigrants | Middle Africa | 33.5 /100 | #185 | Fair 2.2% |
| Native Hawaiians | 33.3 /100 | #186 | Fair 2.2% |
| Immigrants | St. Vincent and the Grenadines | 30.3 /100 | #187 | Fair 2.2% |
| Guyanese | 28.9 /100 | #188 | Fair 2.2% |
| Salvadorans | 27.4 /100 | #189 | Fair 2.2% |
| Immigrants | Costa Rica | 26.1 /100 | #190 | Fair 2.2% |
| Canadians | 25.8 /100 | #191 | Fair 2.2% |
| Europeans | 25.7 /100 | #192 | Fair 2.2% |