Polish vs Immigrants from Nicaragua Vision Disability
COMPARE
Polish
Immigrants from Nicaragua
Vision Disability
Vision Disability Comparison
Poles
Immigrants from Nicaragua
2.1%
VISION DISABILITY
92.0/ 100
METRIC RATING
117th/ 347
METRIC RANK
2.3%
VISION DISABILITY
0.6/ 100
METRIC RATING
243rd/ 347
METRIC RANK
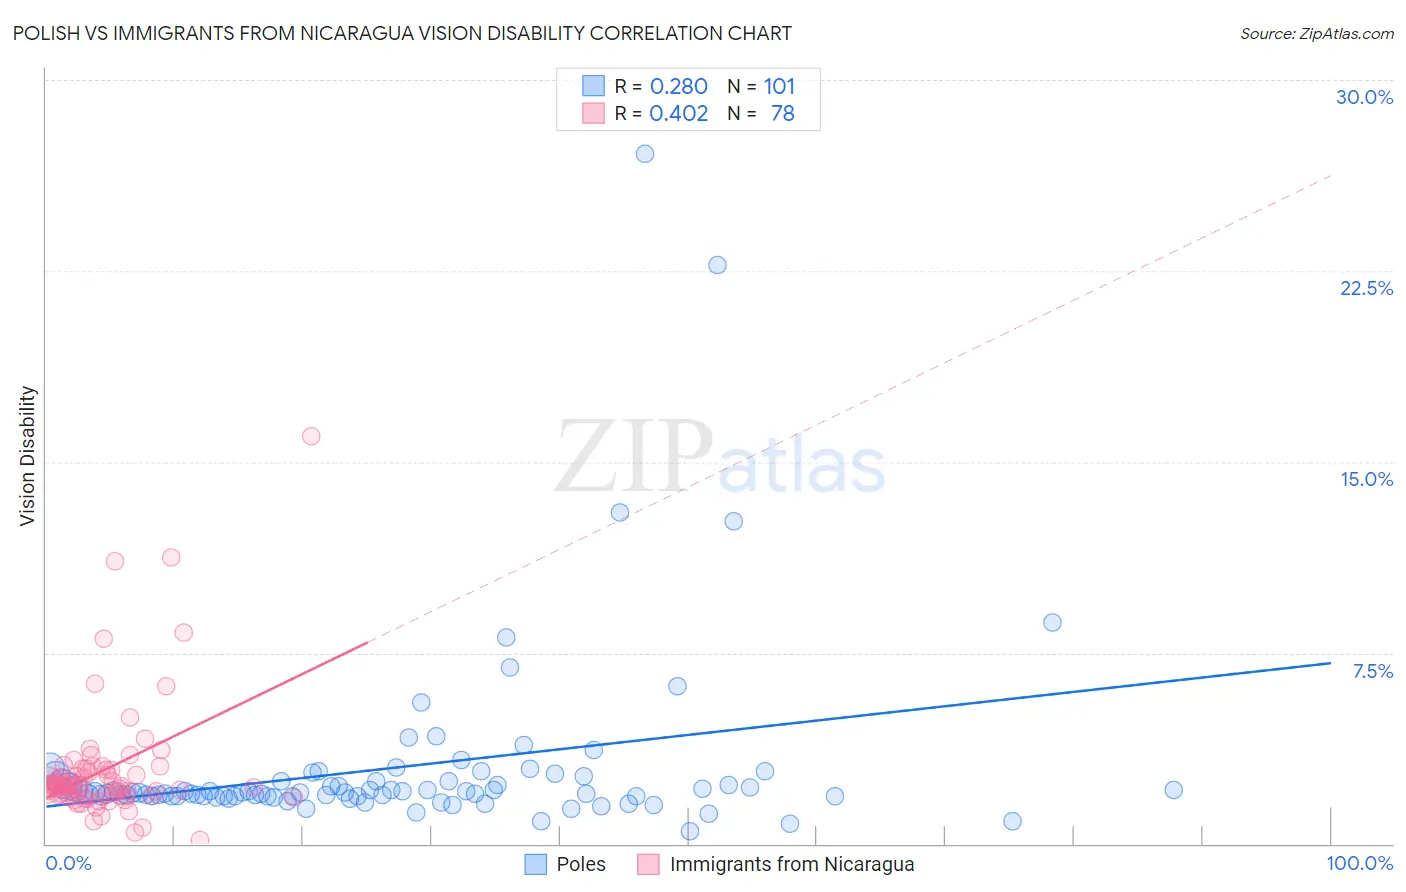
Polish vs Immigrants from Nicaragua Vision Disability Correlation Chart
The statistical analysis conducted on geographies consisting of 558,655,799 people shows a weak positive correlation between the proportion of Poles and percentage of population with vision disability in the United States with a correlation coefficient (R) of 0.280 and weighted average of 2.1%. Similarly, the statistical analysis conducted on geographies consisting of 236,271,642 people shows a moderate positive correlation between the proportion of Immigrants from Nicaragua and percentage of population with vision disability in the United States with a correlation coefficient (R) of 0.402 and weighted average of 2.3%, a difference of 12.3%.
Vision Disability Correlation Summary
| Measurement | Polish | Immigrants from Nicaragua |
| Minimum | 0.47% | 0.13% |
| Maximum | 27.1% | 16.0% |
| Range | 26.7% | 15.9% |
| Mean | 3.0% | 2.9% |
| Median | 2.0% | 2.3% |
| Interquartile 25% (IQ1) | 1.9% | 1.9% |
| Interquartile 75% (IQ3) | 2.5% | 2.9% |
| Interquartile Range (IQR) | 0.60% | 1.0% |
| Standard Deviation (Sample) | 3.7% | 2.4% |
| Standard Deviation (Population) | 3.7% | 2.4% |
Similar Demographics by Vision Disability
Demographics Similar to Poles by Vision Disability
In terms of vision disability, the demographic groups most similar to Poles are Ugandan (2.1%, a difference of 0.040%), Immigrants from Vietnam (2.1%, a difference of 0.050%), Croatian (2.1%, a difference of 0.070%), Kenyan (2.1%, a difference of 0.11%), and Immigrants from Philippines (2.1%, a difference of 0.13%).
| Demographics | Rating | Rank | Vision Disability |
| Immigrants | Armenia | 93.8 /100 | #110 | Exceptional 2.1% |
| Peruvians | 93.5 /100 | #111 | Exceptional 2.1% |
| Immigrants | Denmark | 92.9 /100 | #112 | Exceptional 2.1% |
| Kenyans | 92.5 /100 | #113 | Exceptional 2.1% |
| Croatians | 92.3 /100 | #114 | Exceptional 2.1% |
| Immigrants | Vietnam | 92.2 /100 | #115 | Exceptional 2.1% |
| Ugandans | 92.2 /100 | #116 | Exceptional 2.1% |
| Poles | 92.0 /100 | #117 | Exceptional 2.1% |
| Immigrants | Philippines | 91.4 /100 | #118 | Exceptional 2.1% |
| Immigrants | Uganda | 91.4 /100 | #119 | Exceptional 2.1% |
| Immigrants | Zimbabwe | 91.0 /100 | #120 | Exceptional 2.1% |
| Immigrants | Scotland | 90.4 /100 | #121 | Exceptional 2.1% |
| Immigrants | Ukraine | 90.4 /100 | #122 | Exceptional 2.1% |
| Immigrants | Albania | 90.4 /100 | #123 | Exceptional 2.1% |
| Immigrants | Spain | 89.8 /100 | #124 | Excellent 2.1% |
Demographics Similar to Immigrants from Nicaragua by Vision Disability
In terms of vision disability, the demographic groups most similar to Immigrants from Nicaragua are Immigrants from West Indies (2.3%, a difference of 0.0%), Alsatian (2.3%, a difference of 0.090%), French (2.3%, a difference of 0.24%), Guatemalan (2.3%, a difference of 0.28%), and Subsaharan African (2.3%, a difference of 0.30%).
| Demographics | Rating | Rank | Vision Disability |
| Immigrants | Congo | 1.4 /100 | #236 | Tragic 2.3% |
| Immigrants | Portugal | 1.4 /100 | #237 | Tragic 2.3% |
| Immigrants | Cambodia | 1.1 /100 | #238 | Tragic 2.3% |
| English | 1.1 /100 | #239 | Tragic 2.3% |
| Panamanians | 0.9 /100 | #240 | Tragic 2.3% |
| Malaysians | 0.9 /100 | #241 | Tragic 2.3% |
| Immigrants | Panama | 0.8 /100 | #242 | Tragic 2.3% |
| Immigrants | Nicaragua | 0.6 /100 | #243 | Tragic 2.3% |
| Immigrants | West Indies | 0.6 /100 | #244 | Tragic 2.3% |
| Alsatians | 0.6 /100 | #245 | Tragic 2.3% |
| French | 0.5 /100 | #246 | Tragic 2.3% |
| Guatemalans | 0.5 /100 | #247 | Tragic 2.3% |
| Sub-Saharan Africans | 0.5 /100 | #248 | Tragic 2.3% |
| Liberians | 0.5 /100 | #249 | Tragic 2.3% |
| Bangladeshis | 0.5 /100 | #250 | Tragic 2.3% |