Central American vs Immigrants from Western Europe Disability Age 35 to 64
COMPARE
Central American
Immigrants from Western Europe
Disability Age 35 to 64
Disability Age 35 to 64 Comparison
Central Americans
Immigrants from Western Europe
11.2%
DISABILITY AGE 35 TO 64
59.1/ 100
METRIC RATING
168th/ 347
METRIC RANK
11.1%
DISABILITY AGE 35 TO 64
65.2/ 100
METRIC RATING
165th/ 347
METRIC RANK
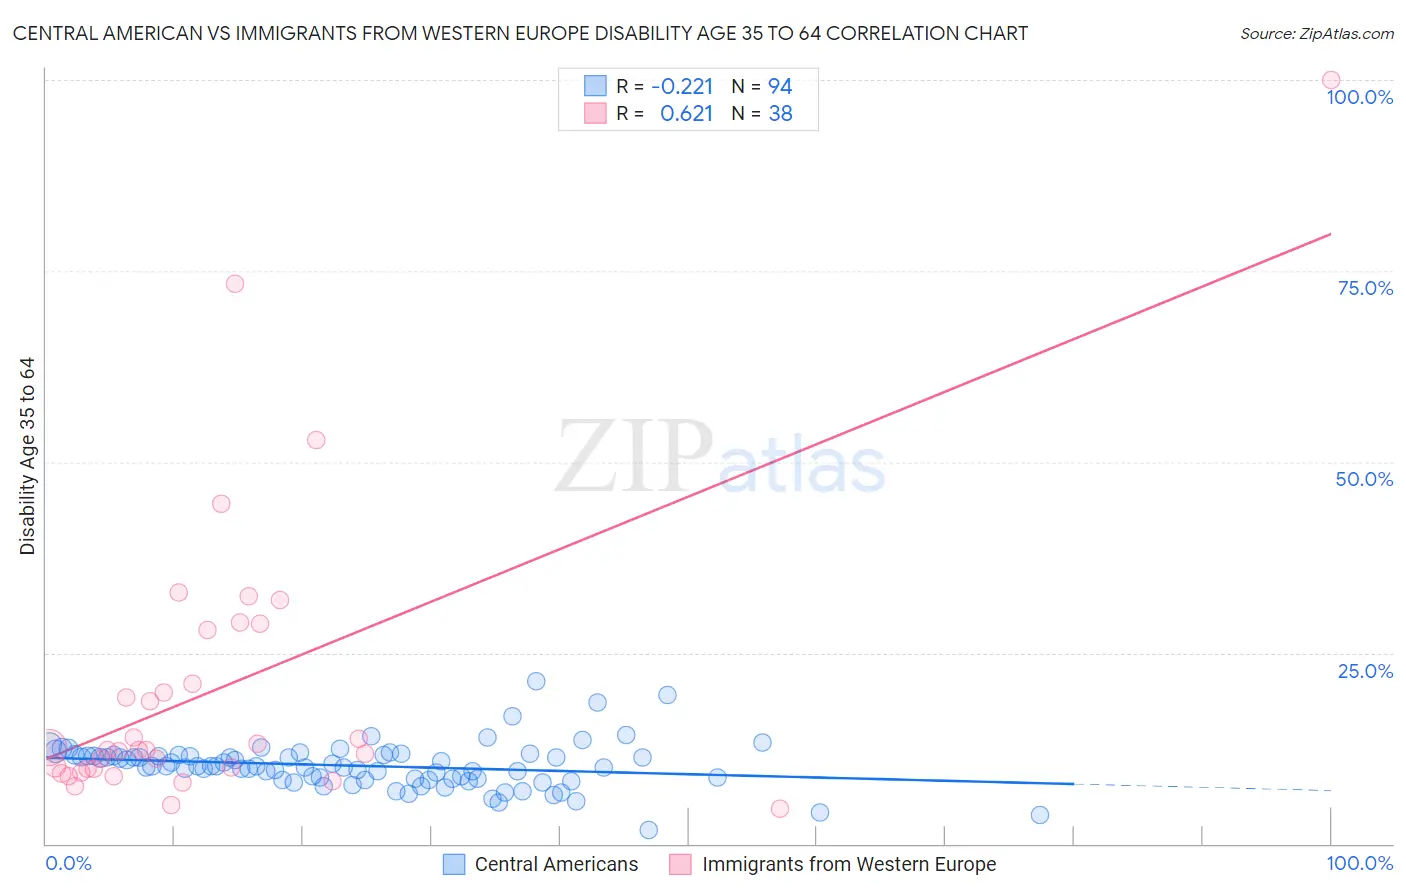
Central American vs Immigrants from Western Europe Disability Age 35 to 64 Correlation Chart
The statistical analysis conducted on geographies consisting of 503,944,688 people shows a weak negative correlation between the proportion of Central Americans and percentage of population with a disability between the ages 34 and 64 in the United States with a correlation coefficient (R) of -0.221 and weighted average of 11.2%. Similarly, the statistical analysis conducted on geographies consisting of 493,692,724 people shows a significant positive correlation between the proportion of Immigrants from Western Europe and percentage of population with a disability between the ages 34 and 64 in the United States with a correlation coefficient (R) of 0.621 and weighted average of 11.1%, a difference of 0.53%.
Disability Age 35 to 64 Correlation Summary
| Measurement | Central American | Immigrants from Western Europe |
| Minimum | 1.8% | 4.6% |
| Maximum | 21.3% | 100.0% |
| Range | 19.5% | 95.4% |
| Mean | 10.2% | 20.5% |
| Median | 10.1% | 12.3% |
| Interquartile 25% (IQ1) | 8.4% | 9.8% |
| Interquartile 75% (IQ3) | 11.5% | 27.9% |
| Interquartile Range (IQR) | 3.1% | 18.1% |
| Standard Deviation (Sample) | 3.0% | 19.5% |
| Standard Deviation (Population) | 3.0% | 19.2% |
Demographics Similar to Central Americans and Immigrants from Western Europe by Disability Age 35 to 64
In terms of disability age 35 to 64, the demographic groups most similar to Central Americans are Haitian (11.2%, a difference of 0.010%), Immigrants from Uganda (11.2%, a difference of 0.090%), Immigrants from Trinidad and Tobago (11.2%, a difference of 0.26%), Italian (11.2%, a difference of 0.29%), and Austrian (11.1%, a difference of 0.35%). Similarly, the demographic groups most similar to Immigrants from Western Europe are Pakistani (11.1%, a difference of 0.050%), Immigrants from Haiti (11.1%, a difference of 0.12%), Immigrants from St. Vincent and the Grenadines (11.1%, a difference of 0.13%), Austrian (11.1%, a difference of 0.17%), and Immigrants from Grenada (11.1%, a difference of 0.29%).
| Demographics | Rating | Rank | Disability Age 35 to 64 |
| Immigrants | Sierra Leone | 76.2 /100 | #156 | Good 11.0% |
| Guyanese | 75.1 /100 | #157 | Good 11.0% |
| Immigrants | North America | 74.9 /100 | #158 | Good 11.0% |
| Serbians | 73.6 /100 | #159 | Good 11.0% |
| Croatians | 73.1 /100 | #160 | Good 11.0% |
| Immigrants | Guyana | 70.1 /100 | #161 | Good 11.1% |
| Immigrants | Grenada | 68.4 /100 | #162 | Good 11.1% |
| Immigrants | St. Vincent and the Grenadines | 66.6 /100 | #163 | Good 11.1% |
| Pakistanis | 65.8 /100 | #164 | Good 11.1% |
| Immigrants | Western Europe | 65.2 /100 | #165 | Good 11.1% |
| Immigrants | Haiti | 63.8 /100 | #166 | Good 11.1% |
| Austrians | 63.2 /100 | #167 | Good 11.1% |
| Central Americans | 59.1 /100 | #168 | Average 11.2% |
| Haitians | 59.0 /100 | #169 | Average 11.2% |
| Immigrants | Uganda | 58.0 /100 | #170 | Average 11.2% |
| Immigrants | Trinidad and Tobago | 55.9 /100 | #171 | Average 11.2% |
| Italians | 55.6 /100 | #172 | Average 11.2% |
| Lebanese | 51.8 /100 | #173 | Average 11.3% |
| Immigrants | Fiji | 50.0 /100 | #174 | Average 11.3% |
| Czechs | 47.9 /100 | #175 | Average 11.3% |
| Ugandans | 43.7 /100 | #176 | Average 11.3% |