Pima vs Salvadoran Cognitive Disability
COMPARE
Pima
Salvadoran
Cognitive Disability
Cognitive Disability Comparison
Pima
Salvadorans
18.8%
COGNITIVE DISABILITY
0.0/ 100
METRIC RATING
331st/ 347
METRIC RANK
17.6%
COGNITIVE DISABILITY
6.7/ 100
METRIC RATING
217th/ 347
METRIC RANK
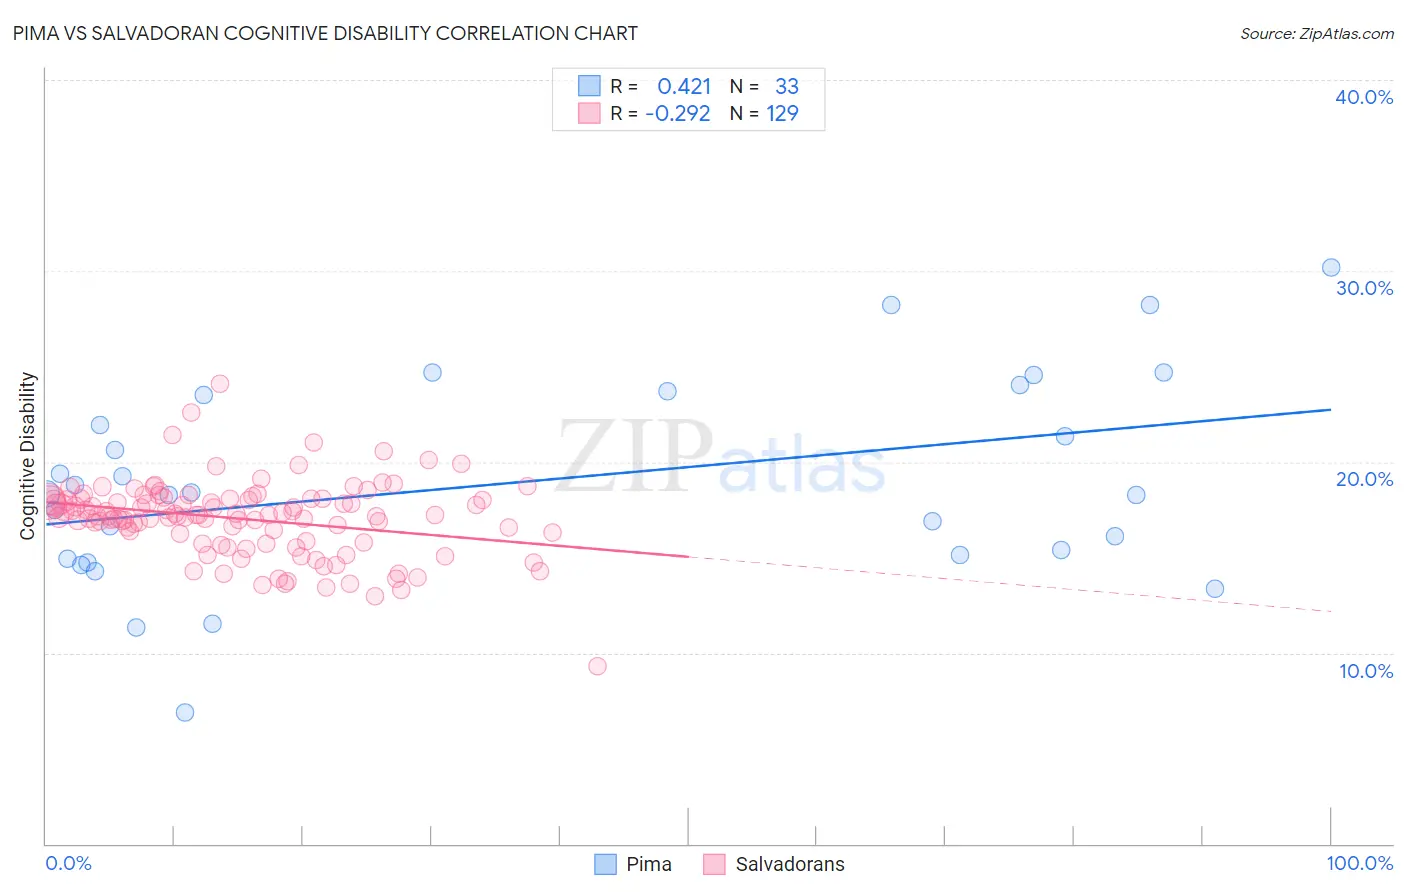
Pima vs Salvadoran Cognitive Disability Correlation Chart
The statistical analysis conducted on geographies consisting of 61,542,171 people shows a moderate positive correlation between the proportion of Pima and percentage of population with cognitive disability in the United States with a correlation coefficient (R) of 0.421 and weighted average of 18.8%. Similarly, the statistical analysis conducted on geographies consisting of 398,952,602 people shows a weak negative correlation between the proportion of Salvadorans and percentage of population with cognitive disability in the United States with a correlation coefficient (R) of -0.292 and weighted average of 17.6%, a difference of 6.8%.
Cognitive Disability Correlation Summary
| Measurement | Pima | Salvadoran |
| Minimum | 6.9% | 9.3% |
| Maximum | 30.2% | 24.1% |
| Range | 23.3% | 14.8% |
| Mean | 19.0% | 17.0% |
| Median | 18.4% | 17.2% |
| Interquartile 25% (IQ1) | 15.0% | 16.0% |
| Interquartile 75% (IQ3) | 23.6% | 18.0% |
| Interquartile Range (IQR) | 8.6% | 2.0% |
| Standard Deviation (Sample) | 5.3% | 2.0% |
| Standard Deviation (Population) | 5.2% | 2.0% |
Similar Demographics by Cognitive Disability
Demographics Similar to Pima by Cognitive Disability
In terms of cognitive disability, the demographic groups most similar to Pima are Immigrants from Sudan (18.8%, a difference of 0.020%), Immigrants from Dominican Republic (18.8%, a difference of 0.070%), Immigrants from Yemen (18.8%, a difference of 0.070%), Navajo (18.8%, a difference of 0.16%), and Kiowa (18.7%, a difference of 0.39%).
| Demographics | Rating | Rank | Cognitive Disability |
| Dominicans | 0.0 /100 | #324 | Tragic 18.7% |
| Indonesians | 0.0 /100 | #325 | Tragic 18.7% |
| Immigrants | Senegal | 0.0 /100 | #326 | Tragic 18.7% |
| U.S. Virgin Islanders | 0.0 /100 | #327 | Tragic 18.7% |
| Kiowa | 0.0 /100 | #328 | Tragic 18.7% |
| Navajo | 0.0 /100 | #329 | Tragic 18.8% |
| Immigrants | Dominican Republic | 0.0 /100 | #330 | Tragic 18.8% |
| Pima | 0.0 /100 | #331 | Tragic 18.8% |
| Immigrants | Sudan | 0.0 /100 | #332 | Tragic 18.8% |
| Immigrants | Yemen | 0.0 /100 | #333 | Tragic 18.8% |
| Sudanese | 0.0 /100 | #334 | Tragic 18.9% |
| Senegalese | 0.0 /100 | #335 | Tragic 19.0% |
| Blacks/African Americans | 0.0 /100 | #336 | Tragic 19.0% |
| Immigrants | Saudi Arabia | 0.0 /100 | #337 | Tragic 19.1% |
| Lumbee | 0.0 /100 | #338 | Tragic 19.1% |
Demographics Similar to Salvadorans by Cognitive Disability
In terms of cognitive disability, the demographic groups most similar to Salvadorans are Alaskan Athabascan (17.6%, a difference of 0.020%), Okinawan (17.6%, a difference of 0.020%), Immigrants from El Salvador (17.6%, a difference of 0.030%), Icelander (17.6%, a difference of 0.030%), and Immigrants from Sierra Leone (17.6%, a difference of 0.040%).
| Demographics | Rating | Rank | Cognitive Disability |
| Immigrants | Jamaica | 8.5 /100 | #210 | Tragic 17.6% |
| Taiwanese | 7.7 /100 | #211 | Tragic 17.6% |
| Immigrants | Oceania | 7.3 /100 | #212 | Tragic 17.6% |
| Hawaiians | 7.2 /100 | #213 | Tragic 17.6% |
| Immigrants | El Salvador | 7.0 /100 | #214 | Tragic 17.6% |
| Alaskan Athabascans | 6.9 /100 | #215 | Tragic 17.6% |
| Okinawans | 6.8 /100 | #216 | Tragic 17.6% |
| Salvadorans | 6.7 /100 | #217 | Tragic 17.6% |
| Icelanders | 6.4 /100 | #218 | Tragic 17.6% |
| Immigrants | Sierra Leone | 6.3 /100 | #219 | Tragic 17.6% |
| Zimbabweans | 6.1 /100 | #220 | Tragic 17.6% |
| Moroccans | 5.9 /100 | #221 | Tragic 17.6% |
| Central Americans | 4.5 /100 | #222 | Tragic 17.7% |
| Alsatians | 4.5 /100 | #223 | Tragic 17.7% |
| Fijians | 3.4 /100 | #224 | Tragic 17.7% |