Peruvian vs Immigrants from Northern Europe Disability Age Over 75
COMPARE
Peruvian
Immigrants from Northern Europe
Disability Age Over 75
Disability Age Over 75 Comparison
Peruvians
Immigrants from Northern Europe
46.8%
DISABILITY AGE OVER 75
86.5/ 100
METRIC RATING
142nd/ 347
METRIC RANK
45.2%
DISABILITY AGE OVER 75
100.0/ 100
METRIC RATING
16th/ 347
METRIC RANK
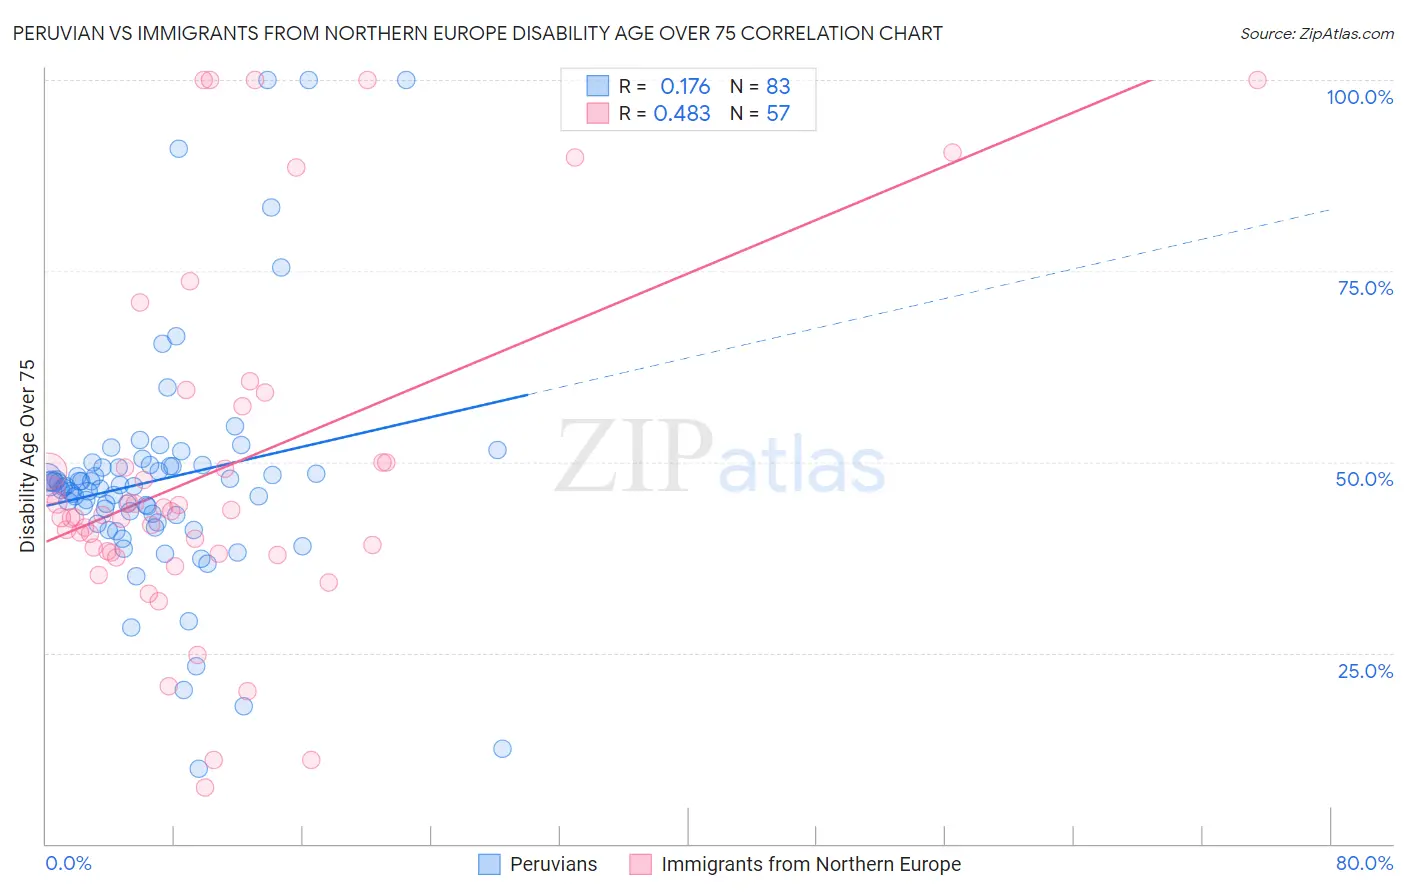
Peruvian vs Immigrants from Northern Europe Disability Age Over 75 Correlation Chart
The statistical analysis conducted on geographies consisting of 362,503,008 people shows a poor positive correlation between the proportion of Peruvians and percentage of population with a disability over the age of 75 in the United States with a correlation coefficient (R) of 0.176 and weighted average of 46.8%. Similarly, the statistical analysis conducted on geographies consisting of 476,324,170 people shows a moderate positive correlation between the proportion of Immigrants from Northern Europe and percentage of population with a disability over the age of 75 in the United States with a correlation coefficient (R) of 0.483 and weighted average of 45.2%, a difference of 3.7%.
Disability Age Over 75 Correlation Summary
| Measurement | Peruvian | Immigrants from Northern Europe |
| Minimum | 9.9% | 7.4% |
| Maximum | 100.0% | 100.0% |
| Range | 90.1% | 92.6% |
| Mean | 47.6% | 49.0% |
| Median | 46.8% | 43.0% |
| Interquartile 25% (IQ1) | 42.1% | 38.0% |
| Interquartile 75% (IQ3) | 49.4% | 53.7% |
| Interquartile Range (IQR) | 7.3% | 15.6% |
| Standard Deviation (Sample) | 15.6% | 22.8% |
| Standard Deviation (Population) | 15.5% | 22.6% |
Similar Demographics by Disability Age Over 75
Demographics Similar to Peruvians by Disability Age Over 75
In terms of disability age over 75, the demographic groups most similar to Peruvians are Lebanese (46.8%, a difference of 0.020%), Bermudan (46.9%, a difference of 0.040%), Immigrants from Costa Rica (46.8%, a difference of 0.050%), Venezuelan (46.9%, a difference of 0.070%), and Costa Rican (46.9%, a difference of 0.090%).
| Demographics | Rating | Rank | Disability Age Over 75 |
| Ethiopians | 88.9 /100 | #135 | Excellent 46.8% |
| Immigrants | Venezuela | 88.6 /100 | #136 | Excellent 46.8% |
| Immigrants | Uganda | 88.5 /100 | #137 | Excellent 46.8% |
| Immigrants | Bosnia and Herzegovina | 88.5 /100 | #138 | Excellent 46.8% |
| Yugoslavians | 88.5 /100 | #139 | Excellent 46.8% |
| Immigrants | Costa Rica | 87.4 /100 | #140 | Excellent 46.8% |
| Lebanese | 87.0 /100 | #141 | Excellent 46.8% |
| Peruvians | 86.5 /100 | #142 | Excellent 46.8% |
| Bermudans | 85.6 /100 | #143 | Excellent 46.9% |
| Venezuelans | 85.0 /100 | #144 | Excellent 46.9% |
| Costa Ricans | 84.5 /100 | #145 | Excellent 46.9% |
| Guyanese | 84.3 /100 | #146 | Excellent 46.9% |
| Immigrants | Peru | 84.1 /100 | #147 | Excellent 46.9% |
| Asians | 81.6 /100 | #148 | Excellent 46.9% |
| Welsh | 81.3 /100 | #149 | Excellent 47.0% |
Demographics Similar to Immigrants from Northern Europe by Disability Age Over 75
In terms of disability age over 75, the demographic groups most similar to Immigrants from Northern Europe are Immigrants from India (45.2%, a difference of 0.010%), Bolivian (45.2%, a difference of 0.040%), Immigrants from Greece (45.2%, a difference of 0.040%), Immigrants from Sweden (45.1%, a difference of 0.090%), and Immigrants from Scotland (45.1%, a difference of 0.14%).
| Demographics | Rating | Rank | Disability Age Over 75 |
| Paraguayans | 100.0 /100 | #9 | Exceptional 45.0% |
| Bulgarians | 100.0 /100 | #10 | Exceptional 45.1% |
| Lithuanians | 100.0 /100 | #11 | Exceptional 45.1% |
| Immigrants | Czechoslovakia | 100.0 /100 | #12 | Exceptional 45.1% |
| Latvians | 100.0 /100 | #13 | Exceptional 45.1% |
| Immigrants | Scotland | 100.0 /100 | #14 | Exceptional 45.1% |
| Immigrants | Sweden | 100.0 /100 | #15 | Exceptional 45.1% |
| Immigrants | Northern Europe | 100.0 /100 | #16 | Exceptional 45.2% |
| Immigrants | India | 100.0 /100 | #17 | Exceptional 45.2% |
| Bolivians | 100.0 /100 | #18 | Exceptional 45.2% |
| Immigrants | Greece | 100.0 /100 | #19 | Exceptional 45.2% |
| Immigrants | Serbia | 100.0 /100 | #20 | Exceptional 45.3% |
| Immigrants | Belgium | 100.0 /100 | #21 | Exceptional 45.3% |
| Immigrants | South Africa | 100.0 /100 | #22 | Exceptional 45.3% |
| Immigrants | Switzerland | 99.9 /100 | #23 | Exceptional 45.3% |