Peruvian vs Yup'ik Births to Unmarried Women
COMPARE
Peruvian
Yup'ik
Births to Unmarried Women
Births to Unmarried Women Comparison
Peruvians
Yup'ik
31.5%
BIRTHS TO UNMARRIED WOMEN
55.5/ 100
METRIC RATING
166th/ 347
METRIC RANK
56.4%
BIRTHS TO UNMARRIED WOMEN
0.0/ 100
METRIC RATING
347th/ 347
METRIC RANK
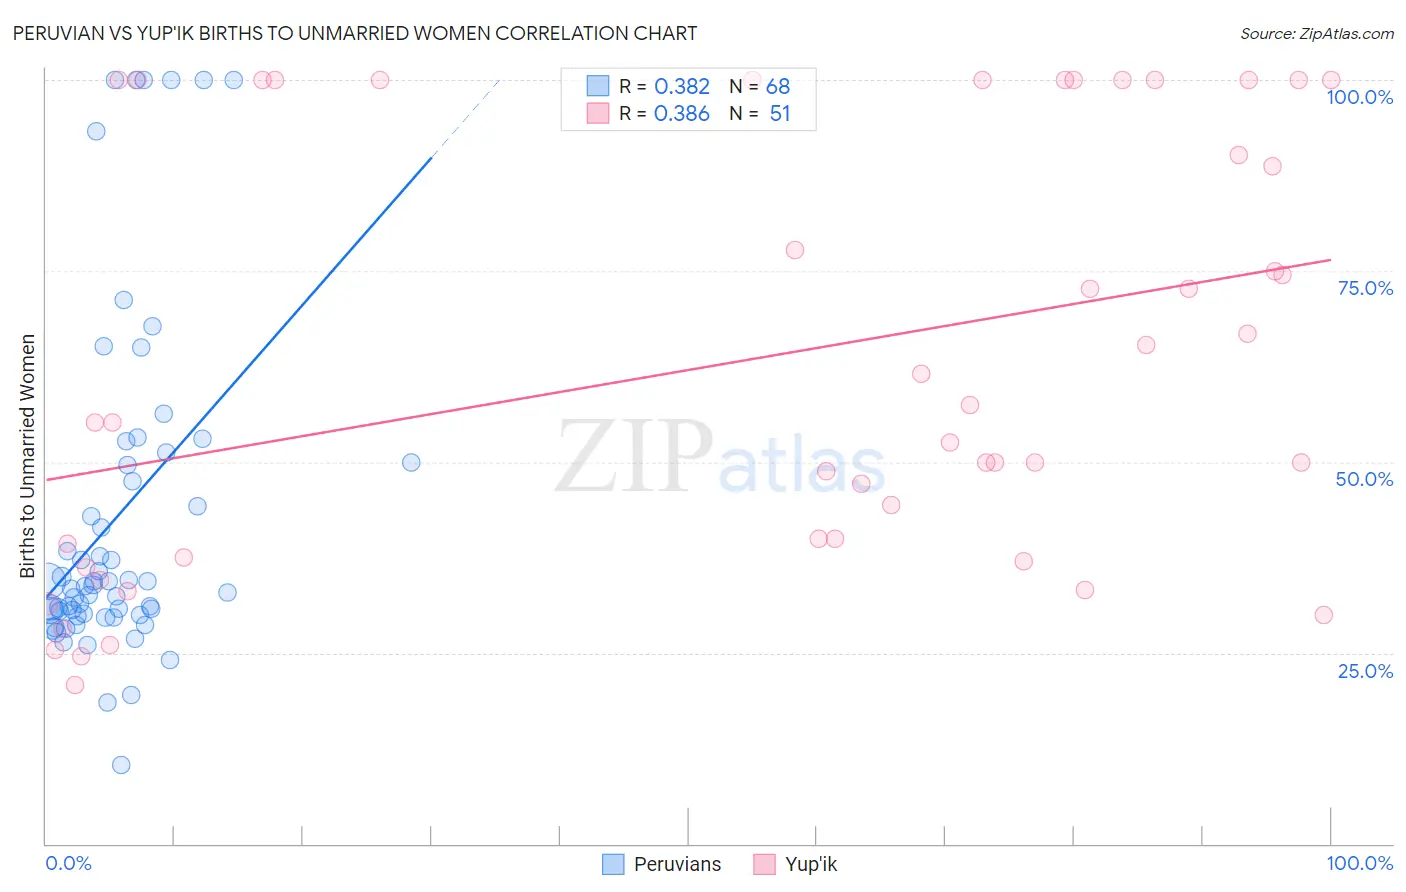
Peruvian vs Yup'ik Births to Unmarried Women Correlation Chart
The statistical analysis conducted on geographies consisting of 342,193,604 people shows a mild positive correlation between the proportion of Peruvians and percentage of births to unmarried women in the United States with a correlation coefficient (R) of 0.382 and weighted average of 31.5%. Similarly, the statistical analysis conducted on geographies consisting of 39,414,518 people shows a mild positive correlation between the proportion of Yup'ik and percentage of births to unmarried women in the United States with a correlation coefficient (R) of 0.386 and weighted average of 56.4%, a difference of 79.1%.
Births to Unmarried Women Correlation Summary
| Measurement | Peruvian | Yup'ik |
| Minimum | 10.2% | 20.7% |
| Maximum | 100.0% | 100.0% |
| Range | 89.8% | 79.3% |
| Mean | 42.7% | 63.2% |
| Median | 33.7% | 55.2% |
| Interquartile 25% (IQ1) | 30.1% | 37.5% |
| Interquartile 75% (IQ3) | 49.8% | 100.0% |
| Interquartile Range (IQR) | 19.7% | 62.5% |
| Standard Deviation (Sample) | 22.3% | 27.8% |
| Standard Deviation (Population) | 22.2% | 27.5% |
Similar Demographics by Births to Unmarried Women
Demographics Similar to Peruvians by Births to Unmarried Women
In terms of births to unmarried women, the demographic groups most similar to Peruvians are Dutch (31.5%, a difference of 0.030%), Immigrants from Somalia (31.4%, a difference of 0.25%), Belgian (31.6%, a difference of 0.30%), Slavic (31.6%, a difference of 0.34%), and Guamanian/Chamorro (31.6%, a difference of 0.40%).
| Demographics | Rating | Rank | Births to Unmarried Women |
| Immigrants | England | 69.4 /100 | #159 | Good 31.1% |
| Immigrants | Western Europe | 69.3 /100 | #160 | Good 31.1% |
| Immigrants | Southern Europe | 68.7 /100 | #161 | Good 31.1% |
| Slovenes | 65.9 /100 | #162 | Good 31.2% |
| Immigrants | Chile | 65.7 /100 | #163 | Good 31.2% |
| Hungarians | 64.1 /100 | #164 | Good 31.2% |
| Immigrants | Somalia | 58.1 /100 | #165 | Average 31.4% |
| Peruvians | 55.5 /100 | #166 | Average 31.5% |
| Dutch | 55.3 /100 | #167 | Average 31.5% |
| Belgians | 52.4 /100 | #168 | Average 31.6% |
| Slavs | 52.0 /100 | #169 | Average 31.6% |
| Guamanians/Chamorros | 51.3 /100 | #170 | Average 31.6% |
| Finns | 50.5 /100 | #171 | Average 31.7% |
| Immigrants | Eritrea | 50.4 /100 | #172 | Average 31.7% |
| Immigrants | Yemen | 50.2 /100 | #173 | Average 31.7% |
Demographics Similar to Yup'ik by Births to Unmarried Women
In terms of births to unmarried women, the demographic groups most similar to Yup'ik are Pueblo (53.7%, a difference of 5.2%), Inupiat (52.1%, a difference of 8.3%), Navajo (51.5%, a difference of 9.6%), Pima (51.5%, a difference of 9.6%), and Menominee (51.1%, a difference of 10.4%).
| Demographics | Rating | Rank | Births to Unmarried Women |
| Blacks/African Americans | 0.0 /100 | #333 | Tragic 44.3% |
| Yuman | 0.0 /100 | #334 | Tragic 44.4% |
| Colville | 0.0 /100 | #335 | Tragic 45.3% |
| Puerto Ricans | 0.0 /100 | #336 | Tragic 45.7% |
| Houma | 0.0 /100 | #337 | Tragic 46.6% |
| Arapaho | 0.0 /100 | #338 | Tragic 47.1% |
| Lumbee | 0.0 /100 | #339 | Tragic 48.2% |
| Tohono O'odham | 0.0 /100 | #340 | Tragic 49.8% |
| Hopi | 0.0 /100 | #341 | Tragic 50.8% |
| Menominee | 0.0 /100 | #342 | Tragic 51.1% |
| Pima | 0.0 /100 | #343 | Tragic 51.5% |
| Navajo | 0.0 /100 | #344 | Tragic 51.5% |
| Inupiat | 0.0 /100 | #345 | Tragic 52.1% |
| Pueblo | 0.0 /100 | #346 | Tragic 53.7% |
| Yup'ik | 0.0 /100 | #347 | Tragic 56.4% |