Peruvian vs Immigrants from Western Europe Disability Age Under 5
COMPARE
Peruvian
Immigrants from Western Europe
Disability Age Under 5
Disability Age Under 5 Comparison
Peruvians
Immigrants from Western Europe
1.3%
DISABILITY AGE UNDER 5
37.6/ 100
METRIC RATING
189th/ 347
METRIC RANK
1.4%
DISABILITY AGE UNDER 5
0.5/ 100
METRIC RATING
256th/ 347
METRIC RANK
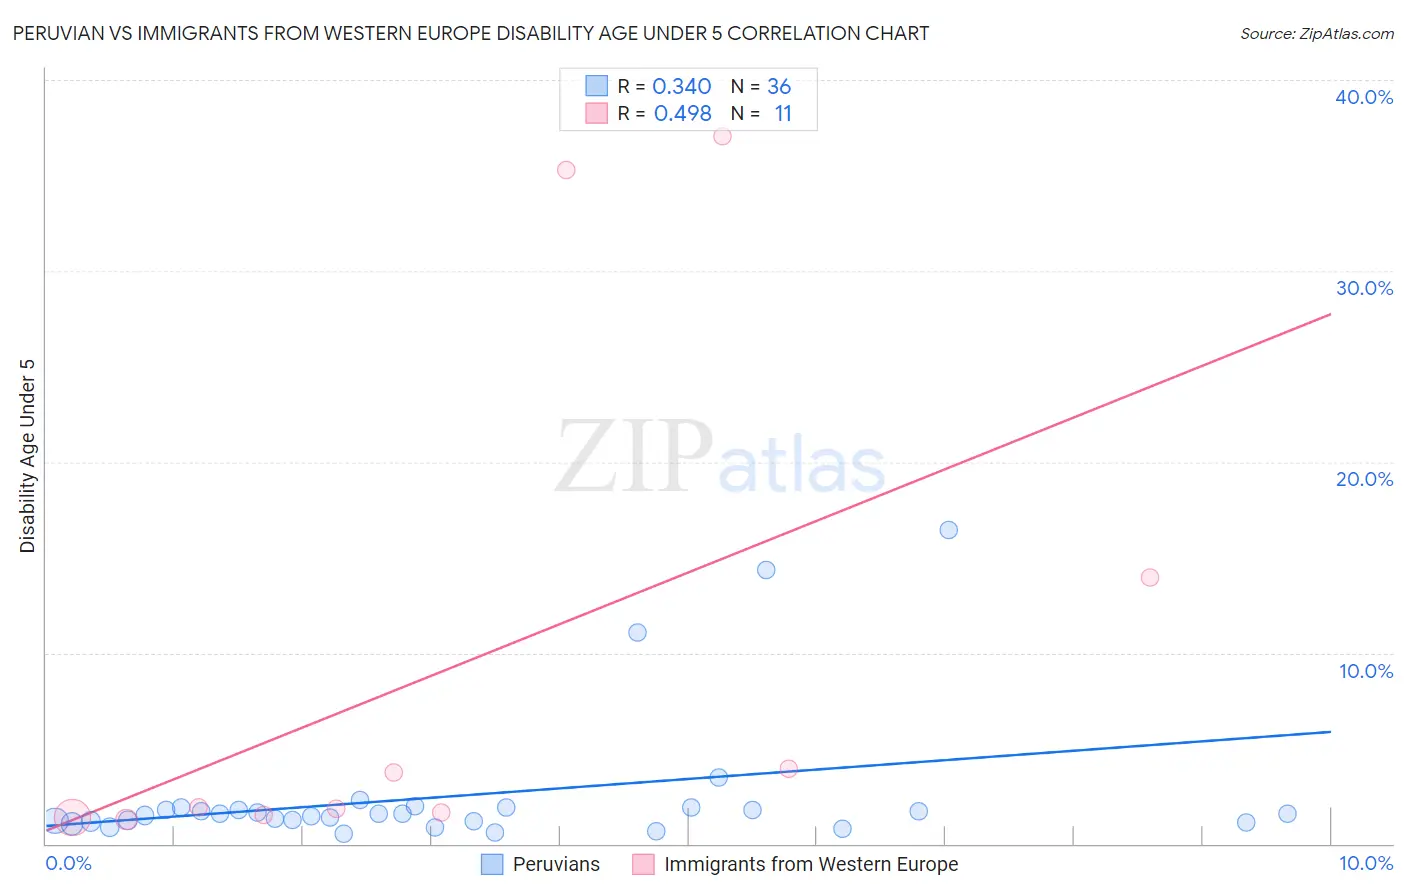
Peruvian vs Immigrants from Western Europe Disability Age Under 5 Correlation Chart
The statistical analysis conducted on geographies consisting of 205,658,783 people shows a mild positive correlation between the proportion of Peruvians and percentage of population with a disability under the age of 5 in the United States with a correlation coefficient (R) of 0.340 and weighted average of 1.3%. Similarly, the statistical analysis conducted on geographies consisting of 244,253,357 people shows a moderate positive correlation between the proportion of Immigrants from Western Europe and percentage of population with a disability under the age of 5 in the United States with a correlation coefficient (R) of 0.498 and weighted average of 1.4%, a difference of 10.6%.
Disability Age Under 5 Correlation Summary
| Measurement | Peruvian | Immigrants from Western Europe |
| Minimum | 0.55% | 1.3% |
| Maximum | 16.5% | 37.0% |
| Range | 15.9% | 35.8% |
| Mean | 2.5% | 9.4% |
| Median | 1.6% | 1.9% |
| Interquartile 25% (IQ1) | 1.2% | 1.5% |
| Interquartile 75% (IQ3) | 1.8% | 14.0% |
| Interquartile Range (IQR) | 0.66% | 12.4% |
| Standard Deviation (Sample) | 3.6% | 13.7% |
| Standard Deviation (Population) | 3.6% | 13.1% |
Similar Demographics by Disability Age Under 5
Demographics Similar to Peruvians by Disability Age Under 5
In terms of disability age under 5, the demographic groups most similar to Peruvians are Immigrants from Laos (1.3%, a difference of 0.090%), Mexican American Indian (1.3%, a difference of 0.10%), Immigrants from Bosnia and Herzegovina (1.3%, a difference of 0.10%), Immigrants from Sierra Leone (1.3%, a difference of 0.11%), and Haitian (1.3%, a difference of 0.22%).
| Demographics | Rating | Rank | Disability Age Under 5 |
| Immigrants | Saudi Arabia | 43.3 /100 | #183 | Average 1.2% |
| Palestinians | 43.0 /100 | #184 | Average 1.2% |
| Immigrants | Western Africa | 42.5 /100 | #185 | Average 1.2% |
| Cubans | 42.5 /100 | #186 | Average 1.2% |
| Immigrants | Haiti | 40.2 /100 | #187 | Average 1.3% |
| Haitians | 39.9 /100 | #188 | Fair 1.3% |
| Peruvians | 37.6 /100 | #189 | Fair 1.3% |
| Immigrants | Laos | 36.6 /100 | #190 | Fair 1.3% |
| Mexican American Indians | 36.6 /100 | #191 | Fair 1.3% |
| Immigrants | Bosnia and Herzegovina | 36.5 /100 | #192 | Fair 1.3% |
| Immigrants | Sierra Leone | 36.5 /100 | #193 | Fair 1.3% |
| Immigrants | North Macedonia | 34.7 /100 | #194 | Fair 1.3% |
| U.S. Virgin Islanders | 34.4 /100 | #195 | Fair 1.3% |
| Immigrants | Belgium | 31.4 /100 | #196 | Fair 1.3% |
Demographics Similar to Immigrants from Western Europe by Disability Age Under 5
In terms of disability age under 5, the demographic groups most similar to Immigrants from Western Europe are Immigrants from Liberia (1.4%, a difference of 0.42%), Immigrants from Brazil (1.4%, a difference of 0.48%), Australian (1.4%, a difference of 0.56%), Slovene (1.4%, a difference of 0.89%), and Costa Rican (1.4%, a difference of 1.1%).
| Demographics | Rating | Rank | Disability Age Under 5 |
| Bermudans | 1.0 /100 | #249 | Tragic 1.4% |
| Africans | 1.0 /100 | #250 | Tragic 1.4% |
| Immigrants | Hungary | 1.0 /100 | #251 | Tragic 1.4% |
| Immigrants | Scotland | 0.9 /100 | #252 | Tragic 1.4% |
| Australians | 0.7 /100 | #253 | Tragic 1.4% |
| Immigrants | Brazil | 0.7 /100 | #254 | Tragic 1.4% |
| Immigrants | Liberia | 0.6 /100 | #255 | Tragic 1.4% |
| Immigrants | Western Europe | 0.5 /100 | #256 | Tragic 1.4% |
| Slovenes | 0.3 /100 | #257 | Tragic 1.4% |
| Costa Ricans | 0.3 /100 | #258 | Tragic 1.4% |
| Immigrants | Southern Europe | 0.3 /100 | #259 | Tragic 1.4% |
| Slavs | 0.3 /100 | #260 | Tragic 1.4% |
| Immigrants | Netherlands | 0.2 /100 | #261 | Tragic 1.4% |
| Immigrants | Dominica | 0.2 /100 | #262 | Tragic 1.4% |
| Spanish | 0.2 /100 | #263 | Tragic 1.4% |