Peruvian vs Immigrants from Hong Kong Disability Age Under 5
COMPARE
Peruvian
Immigrants from Hong Kong
Disability Age Under 5
Disability Age Under 5 Comparison
Peruvians
Immigrants from Hong Kong
1.3%
DISABILITY AGE UNDER 5
37.6/ 100
METRIC RATING
189th/ 347
METRIC RANK
0.95%
DISABILITY AGE UNDER 5
100.0/ 100
METRIC RATING
15th/ 347
METRIC RANK
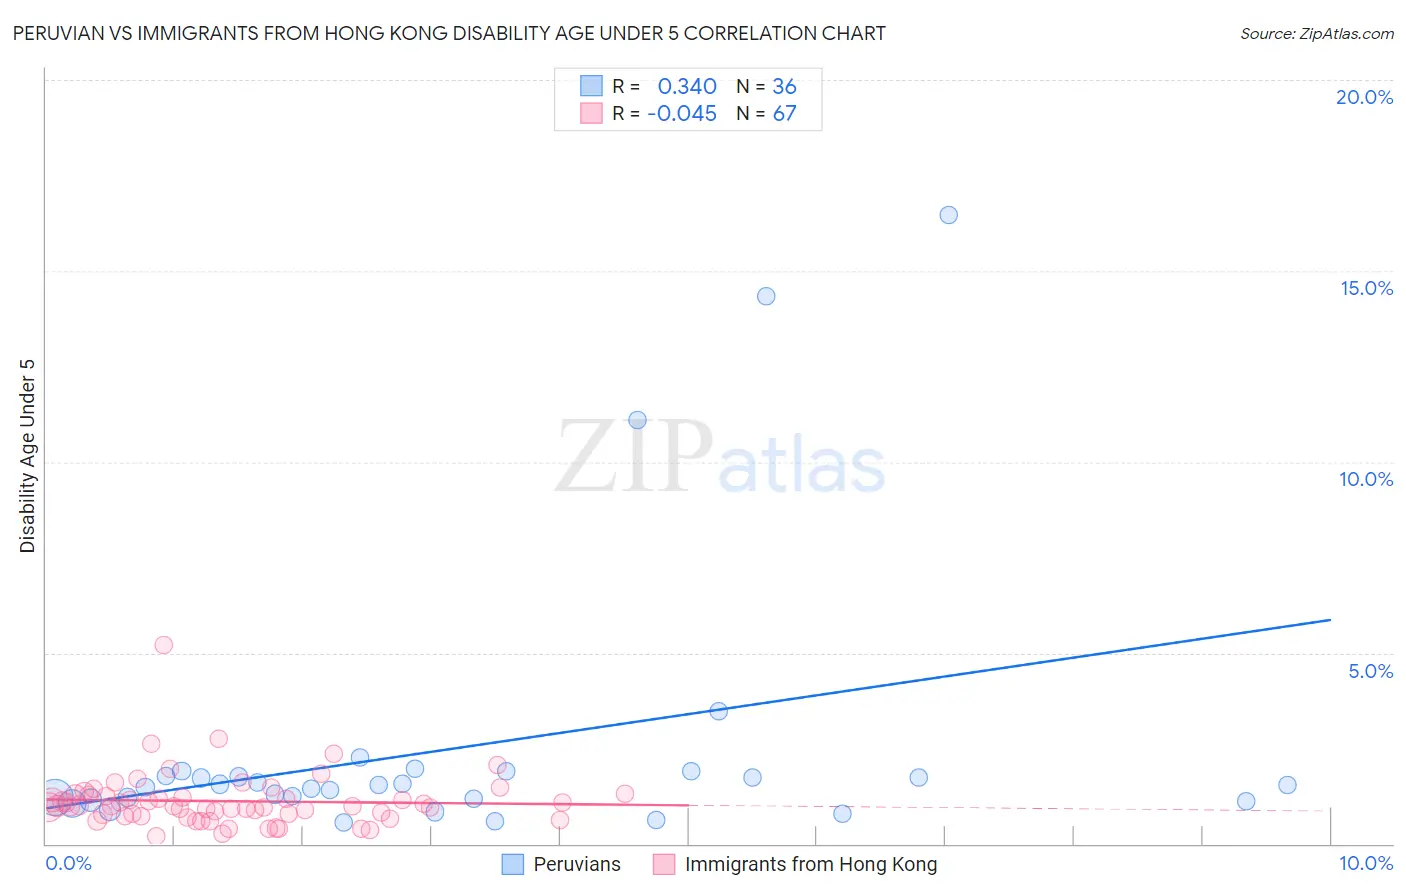
Peruvian vs Immigrants from Hong Kong Disability Age Under 5 Correlation Chart
The statistical analysis conducted on geographies consisting of 205,658,783 people shows a mild positive correlation between the proportion of Peruvians and percentage of population with a disability under the age of 5 in the United States with a correlation coefficient (R) of 0.340 and weighted average of 1.3%. Similarly, the statistical analysis conducted on geographies consisting of 156,756,325 people shows no correlation between the proportion of Immigrants from Hong Kong and percentage of population with a disability under the age of 5 in the United States with a correlation coefficient (R) of -0.045 and weighted average of 0.95%, a difference of 32.5%.
Disability Age Under 5 Correlation Summary
| Measurement | Peruvian | Immigrants from Hong Kong |
| Minimum | 0.55% | 0.19% |
| Maximum | 16.5% | 5.2% |
| Range | 15.9% | 5.0% |
| Mean | 2.5% | 1.1% |
| Median | 1.6% | 0.98% |
| Interquartile 25% (IQ1) | 1.2% | 0.73% |
| Interquartile 75% (IQ3) | 1.8% | 1.3% |
| Interquartile Range (IQR) | 0.66% | 0.55% |
| Standard Deviation (Sample) | 3.6% | 0.72% |
| Standard Deviation (Population) | 3.6% | 0.72% |
Similar Demographics by Disability Age Under 5
Demographics Similar to Peruvians by Disability Age Under 5
In terms of disability age under 5, the demographic groups most similar to Peruvians are Immigrants from Laos (1.3%, a difference of 0.090%), Mexican American Indian (1.3%, a difference of 0.10%), Immigrants from Bosnia and Herzegovina (1.3%, a difference of 0.10%), Immigrants from Sierra Leone (1.3%, a difference of 0.11%), and Haitian (1.3%, a difference of 0.22%).
| Demographics | Rating | Rank | Disability Age Under 5 |
| Immigrants | Saudi Arabia | 43.3 /100 | #183 | Average 1.2% |
| Palestinians | 43.0 /100 | #184 | Average 1.2% |
| Immigrants | Western Africa | 42.5 /100 | #185 | Average 1.2% |
| Cubans | 42.5 /100 | #186 | Average 1.2% |
| Immigrants | Haiti | 40.2 /100 | #187 | Average 1.3% |
| Haitians | 39.9 /100 | #188 | Fair 1.3% |
| Peruvians | 37.6 /100 | #189 | Fair 1.3% |
| Immigrants | Laos | 36.6 /100 | #190 | Fair 1.3% |
| Mexican American Indians | 36.6 /100 | #191 | Fair 1.3% |
| Immigrants | Bosnia and Herzegovina | 36.5 /100 | #192 | Fair 1.3% |
| Immigrants | Sierra Leone | 36.5 /100 | #193 | Fair 1.3% |
| Immigrants | North Macedonia | 34.7 /100 | #194 | Fair 1.3% |
| U.S. Virgin Islanders | 34.4 /100 | #195 | Fair 1.3% |
| Immigrants | Belgium | 31.4 /100 | #196 | Fair 1.3% |
Demographics Similar to Immigrants from Hong Kong by Disability Age Under 5
In terms of disability age under 5, the demographic groups most similar to Immigrants from Hong Kong are Yuman (0.95%, a difference of 0.030%), Soviet Union (0.95%, a difference of 0.11%), Immigrants from Grenada (0.94%, a difference of 0.28%), Afghan (0.94%, a difference of 0.30%), and Marshallese (0.94%, a difference of 1.1%).
| Demographics | Rating | Rank | Disability Age Under 5 |
| Immigrants | Yemen | 100.0 /100 | #8 | Exceptional 0.91% |
| Immigrants | Fiji | 100.0 /100 | #9 | Exceptional 0.92% |
| Marshallese | 100.0 /100 | #10 | Exceptional 0.94% |
| Afghans | 100.0 /100 | #11 | Exceptional 0.94% |
| Immigrants | Grenada | 100.0 /100 | #12 | Exceptional 0.94% |
| Soviet Union | 100.0 /100 | #13 | Exceptional 0.95% |
| Yuman | 100.0 /100 | #14 | Exceptional 0.95% |
| Immigrants | Hong Kong | 100.0 /100 | #15 | Exceptional 0.95% |
| Immigrants | Israel | 100.0 /100 | #16 | Exceptional 0.96% |
| Immigrants | China | 100.0 /100 | #17 | Exceptional 0.96% |
| Immigrants | Barbados | 100.0 /100 | #18 | Exceptional 0.97% |
| Puget Sound Salish | 100.0 /100 | #19 | Exceptional 0.97% |
| Nepalese | 100.0 /100 | #20 | Exceptional 0.97% |
| British West Indians | 100.0 /100 | #21 | Exceptional 0.99% |
| Immigrants | Iran | 100.0 /100 | #22 | Exceptional 1.00% |