Pennsylvania German vs New Zealander Disability Age Over 75
COMPARE
Pennsylvania German
New Zealander
Disability Age Over 75
Disability Age Over 75 Comparison
Pennsylvania Germans
New Zealanders
47.2%
DISABILITY AGE OVER 75
66.0/ 100
METRIC RATING
162nd/ 347
METRIC RANK
46.2%
DISABILITY AGE OVER 75
98.8/ 100
METRIC RATING
81st/ 347
METRIC RANK
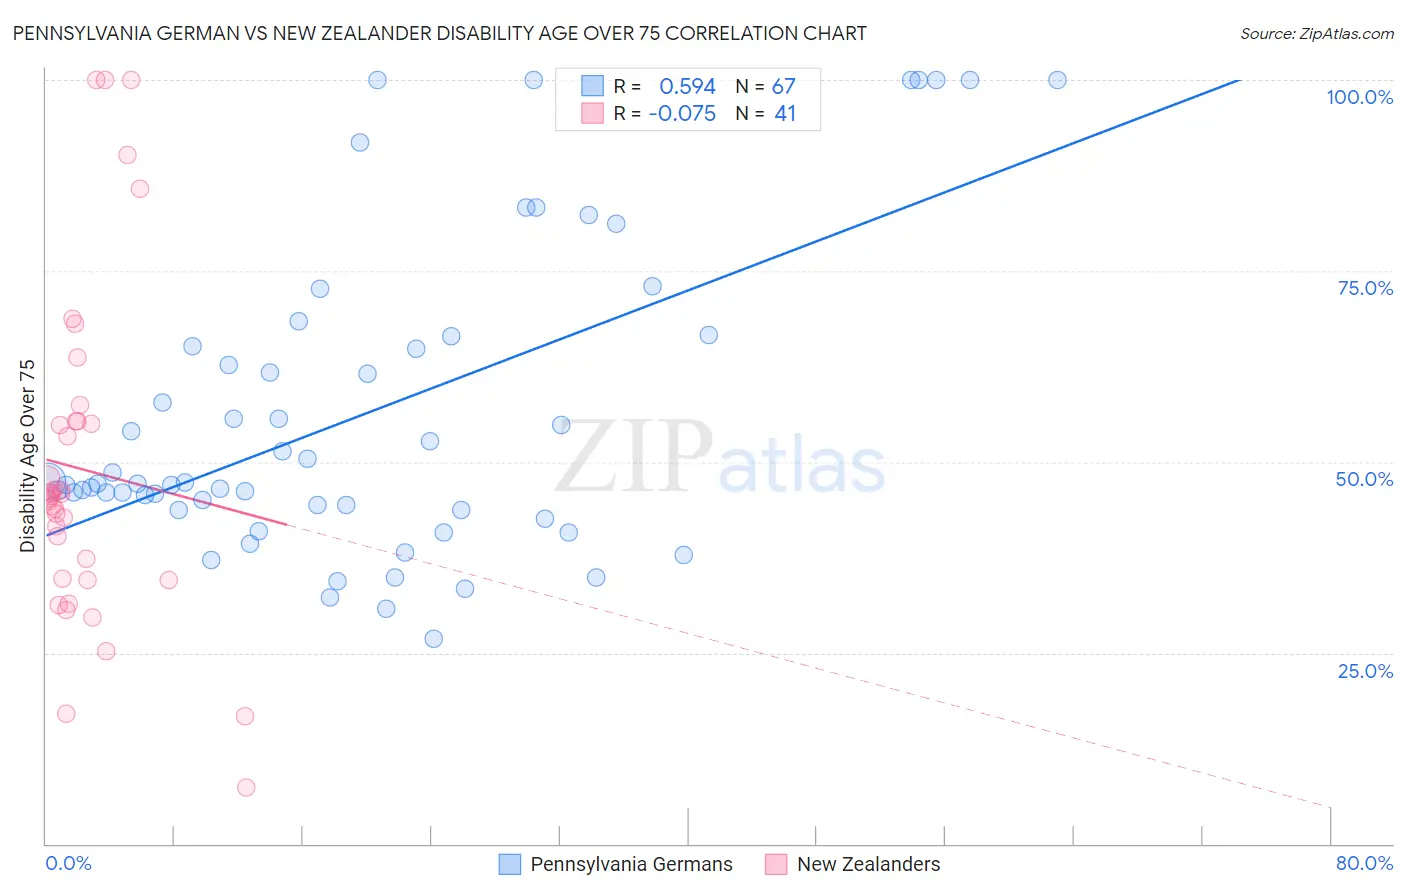
Pennsylvania German vs New Zealander Disability Age Over 75 Correlation Chart
The statistical analysis conducted on geographies consisting of 233,972,902 people shows a substantial positive correlation between the proportion of Pennsylvania Germans and percentage of population with a disability over the age of 75 in the United States with a correlation coefficient (R) of 0.594 and weighted average of 47.2%. Similarly, the statistical analysis conducted on geographies consisting of 106,876,595 people shows a slight negative correlation between the proportion of New Zealanders and percentage of population with a disability over the age of 75 in the United States with a correlation coefficient (R) of -0.075 and weighted average of 46.2%, a difference of 2.1%.
Disability Age Over 75 Correlation Summary
| Measurement | Pennsylvania German | New Zealander |
| Minimum | 26.8% | 7.4% |
| Maximum | 100.0% | 100.0% |
| Range | 73.2% | 92.6% |
| Mean | 56.4% | 49.0% |
| Median | 47.2% | 45.6% |
| Interquartile 25% (IQ1) | 43.8% | 34.6% |
| Interquartile 75% (IQ3) | 66.5% | 55.3% |
| Interquartile Range (IQR) | 22.8% | 20.7% |
| Standard Deviation (Sample) | 20.3% | 21.7% |
| Standard Deviation (Population) | 20.2% | 21.5% |
Similar Demographics by Disability Age Over 75
Demographics Similar to Pennsylvania Germans by Disability Age Over 75
In terms of disability age over 75, the demographic groups most similar to Pennsylvania Germans are Immigrants from Eastern Africa (47.2%, a difference of 0.010%), French (47.2%, a difference of 0.030%), Immigrants from Zimbabwe (47.2%, a difference of 0.040%), Immigrants from Sierra Leone (47.2%, a difference of 0.040%), and South American Indian (47.1%, a difference of 0.050%).
| Demographics | Rating | Rank | Disability Age Over 75 |
| Immigrants | Iran | 74.7 /100 | #155 | Good 47.1% |
| Arabs | 73.3 /100 | #156 | Good 47.1% |
| Bhutanese | 72.6 /100 | #157 | Good 47.1% |
| Immigrants | Guyana | 71.9 /100 | #158 | Good 47.1% |
| Immigrants | Morocco | 71.4 /100 | #159 | Good 47.1% |
| Immigrants | Middle Africa | 68.3 /100 | #160 | Good 47.1% |
| South American Indians | 68.1 /100 | #161 | Good 47.1% |
| Pennsylvania Germans | 66.0 /100 | #162 | Good 47.2% |
| Immigrants | Eastern Africa | 65.5 /100 | #163 | Good 47.2% |
| French | 64.6 /100 | #164 | Good 47.2% |
| Immigrants | Zimbabwe | 64.4 /100 | #165 | Good 47.2% |
| Immigrants | Sierra Leone | 64.4 /100 | #166 | Good 47.2% |
| Moroccans | 62.9 /100 | #167 | Good 47.2% |
| Kenyans | 58.8 /100 | #168 | Average 47.2% |
| Celtics | 58.7 /100 | #169 | Average 47.2% |
Demographics Similar to New Zealanders by Disability Age Over 75
In terms of disability age over 75, the demographic groups most similar to New Zealanders are Soviet Union (46.2%, a difference of 0.0%), Swiss (46.2%, a difference of 0.010%), Immigrants from Latvia (46.2%, a difference of 0.020%), Argentinean (46.2%, a difference of 0.020%), and Immigrants from Jordan (46.2%, a difference of 0.030%).
| Demographics | Rating | Rank | Disability Age Over 75 |
| Egyptians | 99.0 /100 | #74 | Exceptional 46.1% |
| Serbians | 99.0 /100 | #75 | Exceptional 46.1% |
| Slavs | 98.9 /100 | #76 | Exceptional 46.1% |
| Immigrants | Eastern Asia | 98.9 /100 | #77 | Exceptional 46.2% |
| Immigrants | Western Europe | 98.8 /100 | #78 | Exceptional 46.2% |
| Swiss | 98.8 /100 | #79 | Exceptional 46.2% |
| Soviet Union | 98.8 /100 | #80 | Exceptional 46.2% |
| New Zealanders | 98.8 /100 | #81 | Exceptional 46.2% |
| Immigrants | Latvia | 98.7 /100 | #82 | Exceptional 46.2% |
| Argentineans | 98.7 /100 | #83 | Exceptional 46.2% |
| Immigrants | Jordan | 98.7 /100 | #84 | Exceptional 46.2% |
| Immigrants | Southern Europe | 98.6 /100 | #85 | Exceptional 46.2% |
| Romanians | 98.6 /100 | #86 | Exceptional 46.2% |
| Danes | 98.6 /100 | #87 | Exceptional 46.2% |
| Uruguayans | 98.4 /100 | #88 | Exceptional 46.2% |