Pennsylvania German vs Venezuelan Disability Age Over 75
COMPARE
Pennsylvania German
Venezuelan
Disability Age Over 75
Disability Age Over 75 Comparison
Pennsylvania Germans
Venezuelans
47.2%
DISABILITY AGE OVER 75
66.0/ 100
METRIC RATING
162nd/ 347
METRIC RANK
46.9%
DISABILITY AGE OVER 75
85.0/ 100
METRIC RATING
144th/ 347
METRIC RANK
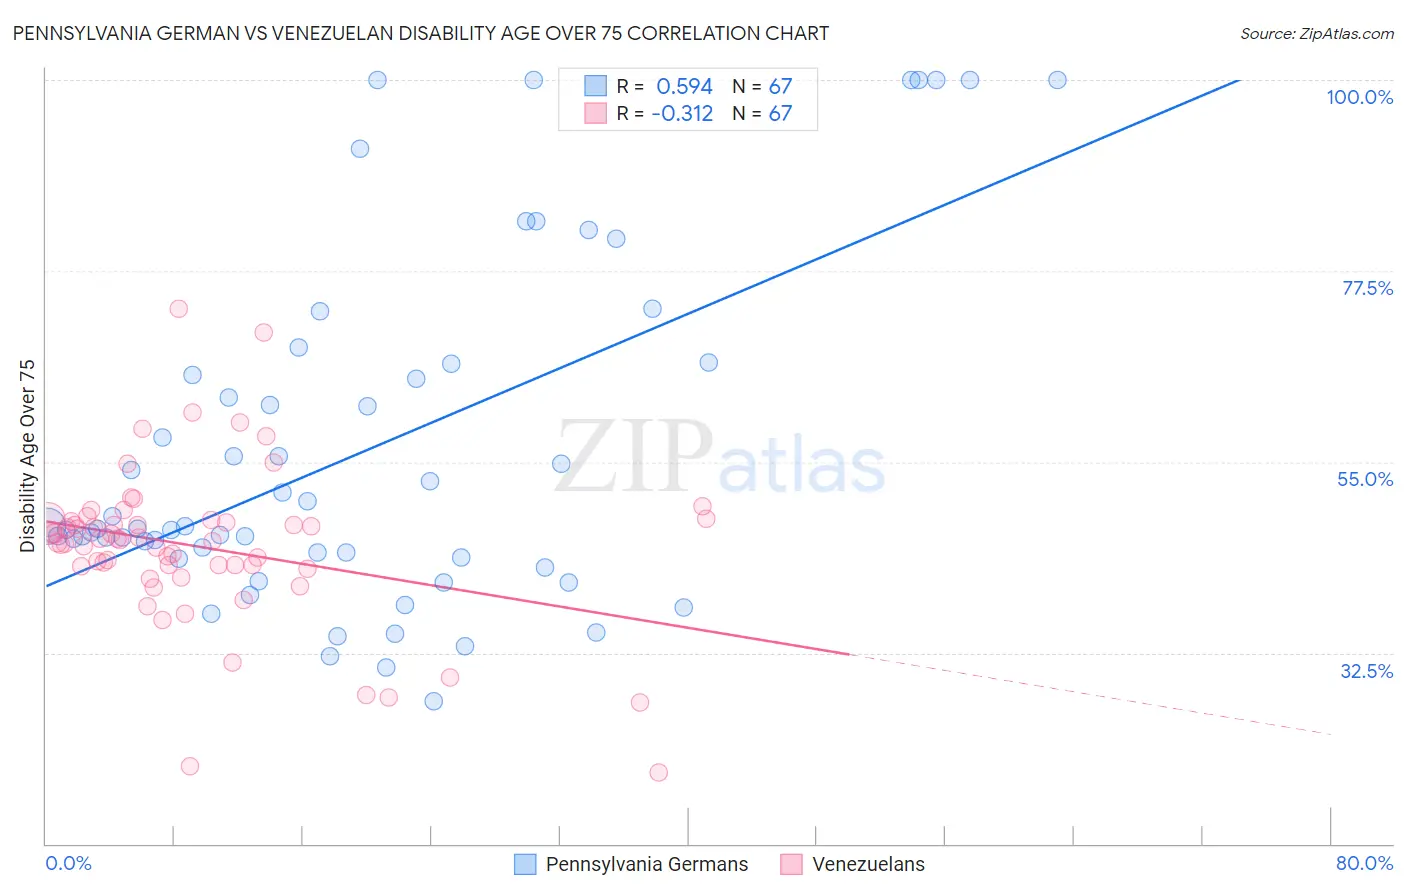
Pennsylvania German vs Venezuelan Disability Age Over 75 Correlation Chart
The statistical analysis conducted on geographies consisting of 233,972,902 people shows a substantial positive correlation between the proportion of Pennsylvania Germans and percentage of population with a disability over the age of 75 in the United States with a correlation coefficient (R) of 0.594 and weighted average of 47.2%. Similarly, the statistical analysis conducted on geographies consisting of 305,815,180 people shows a mild negative correlation between the proportion of Venezuelans and percentage of population with a disability over the age of 75 in the United States with a correlation coefficient (R) of -0.312 and weighted average of 46.9%, a difference of 0.61%.
Disability Age Over 75 Correlation Summary
| Measurement | Pennsylvania German | Venezuelan |
| Minimum | 26.8% | 18.4% |
| Maximum | 100.0% | 73.0% |
| Range | 73.2% | 54.6% |
| Mean | 56.4% | 45.0% |
| Median | 47.2% | 45.9% |
| Interquartile 25% (IQ1) | 43.8% | 42.7% |
| Interquartile 75% (IQ3) | 66.5% | 48.1% |
| Interquartile Range (IQR) | 22.8% | 5.4% |
| Standard Deviation (Sample) | 20.3% | 9.4% |
| Standard Deviation (Population) | 20.2% | 9.3% |
Demographics Similar to Pennsylvania Germans and Venezuelans by Disability Age Over 75
In terms of disability age over 75, the demographic groups most similar to Pennsylvania Germans are Immigrants from Eastern Africa (47.2%, a difference of 0.010%), South American Indian (47.1%, a difference of 0.050%), Immigrants from Middle Africa (47.1%, a difference of 0.060%), Immigrants from Morocco (47.1%, a difference of 0.14%), and Immigrants from Guyana (47.1%, a difference of 0.16%). Similarly, the demographic groups most similar to Venezuelans are Bermudan (46.9%, a difference of 0.020%), Costa Rican (46.9%, a difference of 0.020%), Guyanese (46.9%, a difference of 0.030%), Immigrants from Peru (46.9%, a difference of 0.040%), and Asian (46.9%, a difference of 0.14%).
| Demographics | Rating | Rank | Disability Age Over 75 |
| Bermudans | 85.6 /100 | #143 | Excellent 46.9% |
| Venezuelans | 85.0 /100 | #144 | Excellent 46.9% |
| Costa Ricans | 84.5 /100 | #145 | Excellent 46.9% |
| Guyanese | 84.3 /100 | #146 | Excellent 46.9% |
| Immigrants | Peru | 84.1 /100 | #147 | Excellent 46.9% |
| Asians | 81.6 /100 | #148 | Excellent 46.9% |
| Welsh | 81.3 /100 | #149 | Excellent 47.0% |
| Immigrants | Russia | 79.3 /100 | #150 | Good 47.0% |
| French Canadians | 79.0 /100 | #151 | Good 47.0% |
| Immigrants | Asia | 76.5 /100 | #152 | Good 47.0% |
| Immigrants | Zaire | 74.8 /100 | #153 | Good 47.1% |
| Immigrants | Belarus | 74.8 /100 | #154 | Good 47.1% |
| Immigrants | Iran | 74.7 /100 | #155 | Good 47.1% |
| Arabs | 73.3 /100 | #156 | Good 47.1% |
| Bhutanese | 72.6 /100 | #157 | Good 47.1% |
| Immigrants | Guyana | 71.9 /100 | #158 | Good 47.1% |
| Immigrants | Morocco | 71.4 /100 | #159 | Good 47.1% |
| Immigrants | Middle Africa | 68.3 /100 | #160 | Good 47.1% |
| South American Indians | 68.1 /100 | #161 | Good 47.1% |
| Pennsylvania Germans | 66.0 /100 | #162 | Good 47.2% |
| Immigrants | Eastern Africa | 65.5 /100 | #163 | Good 47.2% |