Basque vs Immigrants from Senegal Disability Age Over 75
COMPARE
Basque
Immigrants from Senegal
Disability Age Over 75
Disability Age Over 75 Comparison
Basques
Immigrants from Senegal
47.6%
DISABILITY AGE OVER 75
30.9/ 100
METRIC RATING
188th/ 347
METRIC RANK
47.8%
DISABILITY AGE OVER 75
16.9/ 100
METRIC RATING
208th/ 347
METRIC RANK
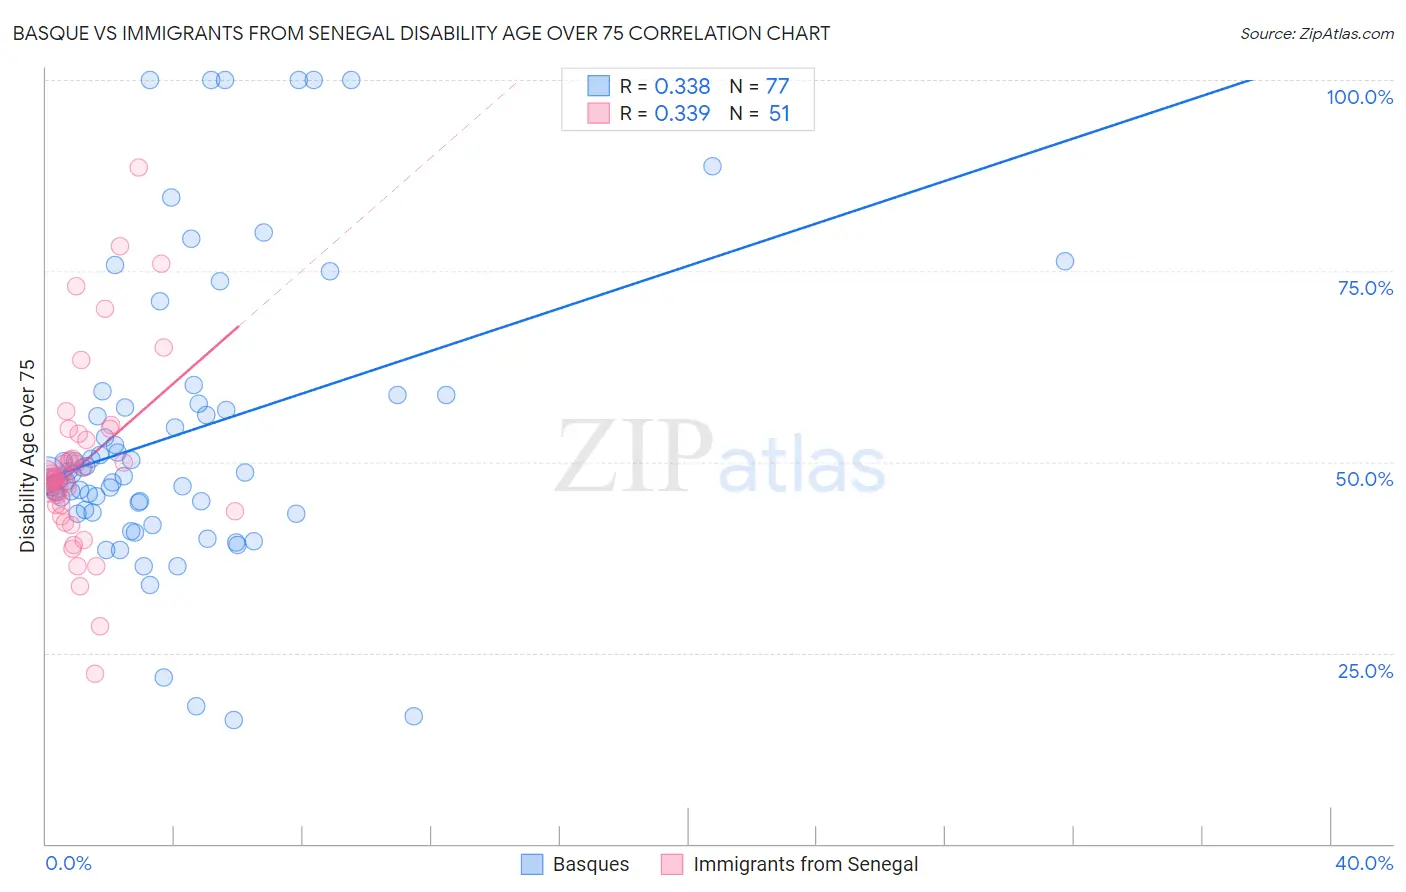
Basque vs Immigrants from Senegal Disability Age Over 75 Correlation Chart
The statistical analysis conducted on geographies consisting of 165,667,068 people shows a mild positive correlation between the proportion of Basques and percentage of population with a disability over the age of 75 in the United States with a correlation coefficient (R) of 0.338 and weighted average of 47.6%. Similarly, the statistical analysis conducted on geographies consisting of 90,077,022 people shows a mild positive correlation between the proportion of Immigrants from Senegal and percentage of population with a disability over the age of 75 in the United States with a correlation coefficient (R) of 0.339 and weighted average of 47.8%, a difference of 0.44%.
Disability Age Over 75 Correlation Summary
| Measurement | Basque | Immigrants from Senegal |
| Minimum | 16.2% | 22.2% |
| Maximum | 100.0% | 88.5% |
| Range | 83.8% | 66.3% |
| Mean | 53.6% | 49.6% |
| Median | 48.2% | 47.8% |
| Interquartile 25% (IQ1) | 43.5% | 44.3% |
| Interquartile 75% (IQ3) | 58.2% | 52.9% |
| Interquartile Range (IQR) | 14.7% | 8.6% |
| Standard Deviation (Sample) | 19.2% | 11.9% |
| Standard Deviation (Population) | 19.1% | 11.8% |
Demographics Similar to Basques and Immigrants from Senegal by Disability Age Over 75
In terms of disability age over 75, the demographic groups most similar to Basques are Immigrants from Kenya (47.6%, a difference of 0.0%), Somali (47.6%, a difference of 0.040%), Portuguese (47.6%, a difference of 0.040%), Immigrants from Jamaica (47.6%, a difference of 0.070%), and Ottawa (47.6%, a difference of 0.070%). Similarly, the demographic groups most similar to Immigrants from Senegal are Immigrants from Syria (47.8%, a difference of 0.020%), Immigrants from Ghana (47.7%, a difference of 0.080%), Jamaican (47.7%, a difference of 0.080%), Nigerian (47.7%, a difference of 0.090%), and Trinidadian and Tobagonian (47.7%, a difference of 0.12%).
| Demographics | Rating | Rank | Disability Age Over 75 |
| Basques | 30.9 /100 | #188 | Fair 47.6% |
| Immigrants | Kenya | 30.8 /100 | #189 | Fair 47.6% |
| Somalis | 29.5 /100 | #190 | Fair 47.6% |
| Portuguese | 29.3 /100 | #191 | Fair 47.6% |
| Immigrants | Jamaica | 28.3 /100 | #192 | Fair 47.6% |
| Ottawa | 28.1 /100 | #193 | Fair 47.6% |
| Immigrants | Lebanon | 26.5 /100 | #194 | Fair 47.6% |
| Immigrants | Trinidad and Tobago | 25.3 /100 | #195 | Fair 47.6% |
| Immigrants | Portugal | 23.8 /100 | #196 | Fair 47.6% |
| Pakistanis | 23.4 /100 | #197 | Fair 47.7% |
| Immigrants | Ukraine | 23.2 /100 | #198 | Fair 47.7% |
| Immigrants | Eritrea | 22.4 /100 | #199 | Fair 47.7% |
| Immigrants | Somalia | 21.4 /100 | #200 | Fair 47.7% |
| Immigrants | Cuba | 20.9 /100 | #201 | Fair 47.7% |
| Immigrants | Bahamas | 20.7 /100 | #202 | Fair 47.7% |
| Trinidadians and Tobagonians | 20.0 /100 | #203 | Fair 47.7% |
| Nigerians | 19.2 /100 | #204 | Poor 47.7% |
| Immigrants | Ghana | 19.1 /100 | #205 | Poor 47.7% |
| Jamaicans | 19.0 /100 | #206 | Poor 47.7% |
| Immigrants | Syria | 17.4 /100 | #207 | Poor 47.8% |
| Immigrants | Senegal | 16.9 /100 | #208 | Poor 47.8% |