Somali vs Immigrants from Senegal Disability Age Over 75
COMPARE
Somali
Immigrants from Senegal
Disability Age Over 75
Disability Age Over 75 Comparison
Somalis
Immigrants from Senegal
47.6%
DISABILITY AGE OVER 75
29.5/ 100
METRIC RATING
190th/ 347
METRIC RANK
47.8%
DISABILITY AGE OVER 75
16.9/ 100
METRIC RATING
208th/ 347
METRIC RANK
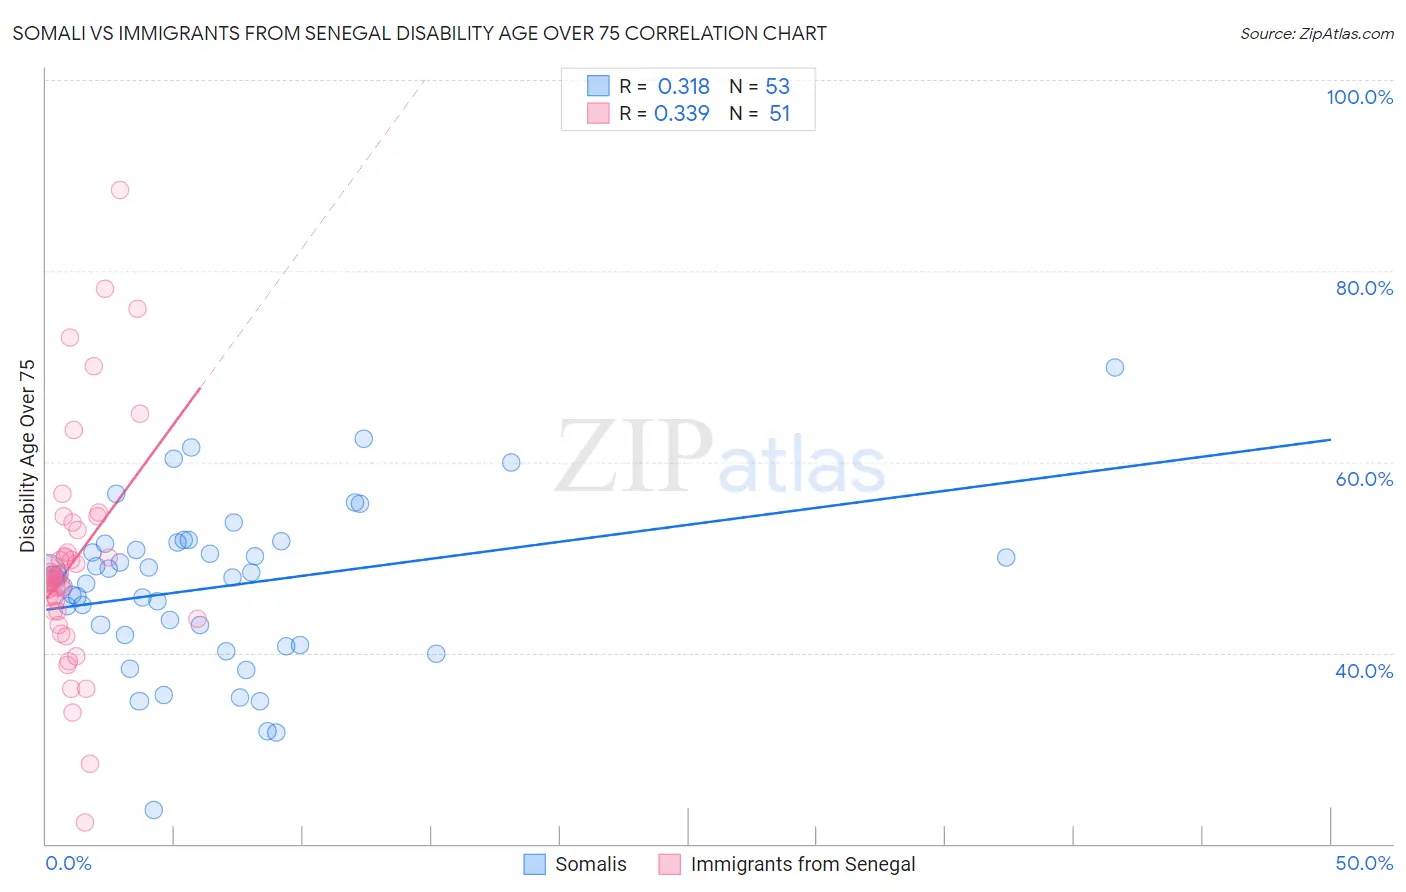
Somali vs Immigrants from Senegal Disability Age Over 75 Correlation Chart
The statistical analysis conducted on geographies consisting of 99,187,417 people shows a mild positive correlation between the proportion of Somalis and percentage of population with a disability over the age of 75 in the United States with a correlation coefficient (R) of 0.318 and weighted average of 47.6%. Similarly, the statistical analysis conducted on geographies consisting of 90,077,022 people shows a mild positive correlation between the proportion of Immigrants from Senegal and percentage of population with a disability over the age of 75 in the United States with a correlation coefficient (R) of 0.339 and weighted average of 47.8%, a difference of 0.40%.
Disability Age Over 75 Correlation Summary
| Measurement | Somali | Immigrants from Senegal |
| Minimum | 23.5% | 22.2% |
| Maximum | 69.9% | 88.5% |
| Range | 46.4% | 66.3% |
| Mean | 46.9% | 49.6% |
| Median | 48.0% | 47.8% |
| Interquartile 25% (IQ1) | 41.4% | 44.3% |
| Interquartile 75% (IQ3) | 51.5% | 52.9% |
| Interquartile Range (IQR) | 10.1% | 8.6% |
| Standard Deviation (Sample) | 8.5% | 11.9% |
| Standard Deviation (Population) | 8.5% | 11.8% |
Demographics Similar to Somalis and Immigrants from Senegal by Disability Age Over 75
In terms of disability age over 75, the demographic groups most similar to Somalis are Portuguese (47.6%, a difference of 0.010%), Immigrants from Jamaica (47.6%, a difference of 0.030%), Immigrants from Kenya (47.6%, a difference of 0.040%), Ottawa (47.6%, a difference of 0.040%), and Immigrants from Lebanon (47.6%, a difference of 0.080%). Similarly, the demographic groups most similar to Immigrants from Senegal are Immigrants from Syria (47.8%, a difference of 0.020%), Immigrants from Ghana (47.7%, a difference of 0.080%), Jamaican (47.7%, a difference of 0.080%), Nigerian (47.7%, a difference of 0.090%), and Immigrants from Indonesia (47.8%, a difference of 0.11%).
| Demographics | Rating | Rank | Disability Age Over 75 |
| Immigrants | Kenya | 30.8 /100 | #189 | Fair 47.6% |
| Somalis | 29.5 /100 | #190 | Fair 47.6% |
| Portuguese | 29.3 /100 | #191 | Fair 47.6% |
| Immigrants | Jamaica | 28.3 /100 | #192 | Fair 47.6% |
| Ottawa | 28.1 /100 | #193 | Fair 47.6% |
| Immigrants | Lebanon | 26.5 /100 | #194 | Fair 47.6% |
| Immigrants | Trinidad and Tobago | 25.3 /100 | #195 | Fair 47.6% |
| Immigrants | Portugal | 23.8 /100 | #196 | Fair 47.6% |
| Pakistanis | 23.4 /100 | #197 | Fair 47.7% |
| Immigrants | Ukraine | 23.2 /100 | #198 | Fair 47.7% |
| Immigrants | Eritrea | 22.4 /100 | #199 | Fair 47.7% |
| Immigrants | Somalia | 21.4 /100 | #200 | Fair 47.7% |
| Immigrants | Cuba | 20.9 /100 | #201 | Fair 47.7% |
| Immigrants | Bahamas | 20.7 /100 | #202 | Fair 47.7% |
| Trinidadians and Tobagonians | 20.0 /100 | #203 | Fair 47.7% |
| Nigerians | 19.2 /100 | #204 | Poor 47.7% |
| Immigrants | Ghana | 19.1 /100 | #205 | Poor 47.7% |
| Jamaicans | 19.0 /100 | #206 | Poor 47.7% |
| Immigrants | Syria | 17.4 /100 | #207 | Poor 47.8% |
| Immigrants | Senegal | 16.9 /100 | #208 | Poor 47.8% |
| Immigrants | Indonesia | 14.2 /100 | #209 | Poor 47.8% |