Immigrants from Thailand vs Nonimmigrants Disability Age 65 to 74
COMPARE
Immigrants from Thailand
Nonimmigrants
Disability Age 65 to 74
Disability Age 65 to 74 Comparison
Immigrants from Thailand
Nonimmigrants
24.3%
DISABILITY AGE 65 TO 74
5.2/ 100
METRIC RATING
231st/ 347
METRIC RANK
25.0%
DISABILITY AGE 65 TO 74
0.7/ 100
METRIC RATING
251st/ 347
METRIC RANK
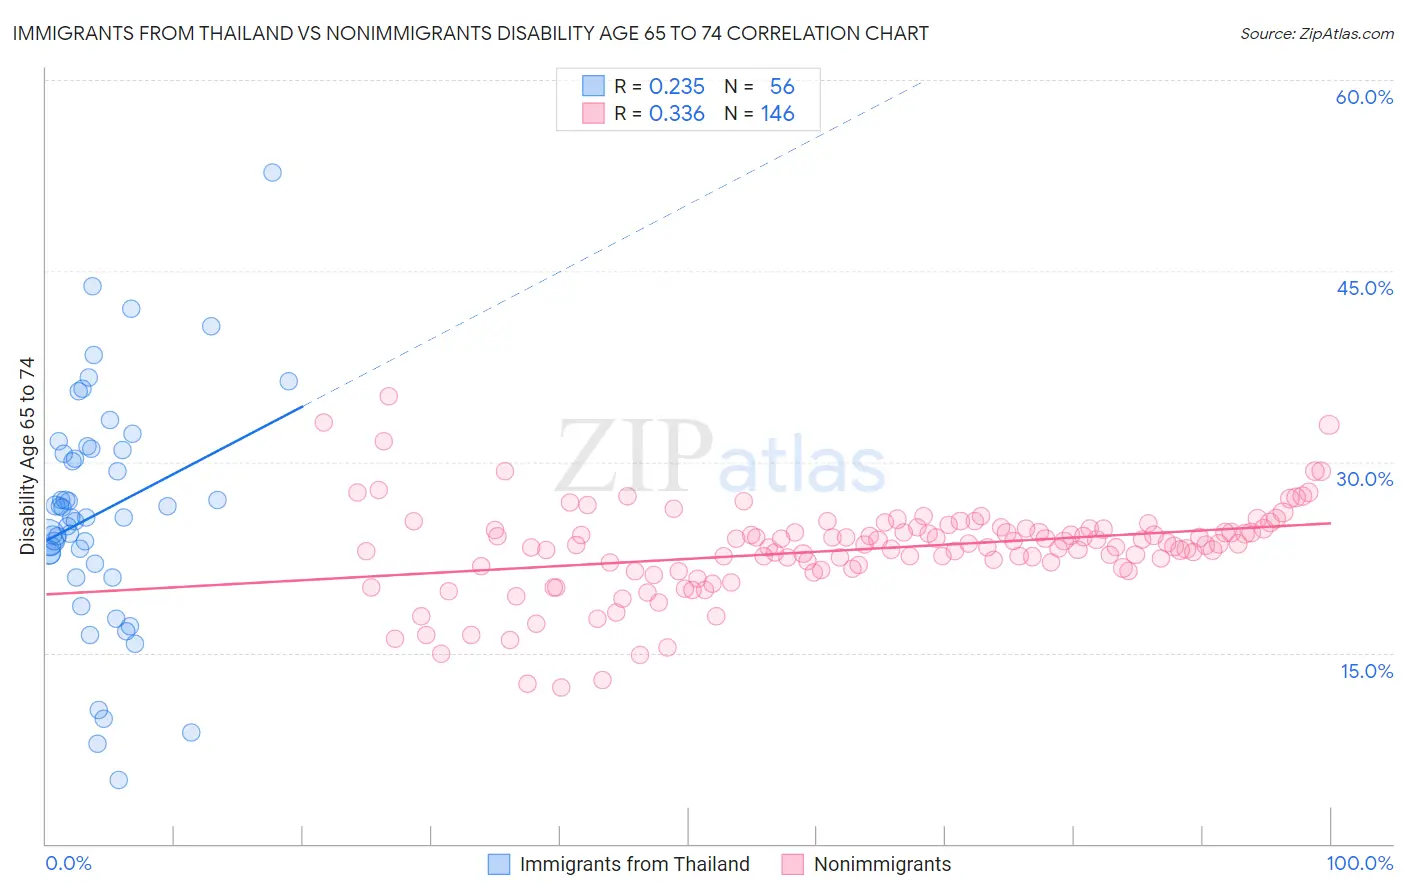
Immigrants from Thailand vs Nonimmigrants Disability Age 65 to 74 Correlation Chart
The statistical analysis conducted on geographies consisting of 316,664,344 people shows a weak positive correlation between the proportion of Immigrants from Thailand and percentage of population with a disability between the ages 65 and 75 in the United States with a correlation coefficient (R) of 0.235 and weighted average of 24.3%. Similarly, the statistical analysis conducted on geographies consisting of 581,657,399 people shows a mild positive correlation between the proportion of Nonimmigrants and percentage of population with a disability between the ages 65 and 75 in the United States with a correlation coefficient (R) of 0.336 and weighted average of 25.0%, a difference of 2.9%.
Disability Age 65 to 74 Correlation Summary
| Measurement | Immigrants from Thailand | Nonimmigrants |
| Minimum | 5.0% | 12.3% |
| Maximum | 52.8% | 35.2% |
| Range | 47.8% | 22.8% |
| Mean | 26.0% | 23.1% |
| Median | 25.7% | 23.5% |
| Interquartile 25% (IQ1) | 22.4% | 21.7% |
| Interquartile 75% (IQ3) | 31.0% | 24.8% |
| Interquartile Range (IQR) | 8.6% | 3.1% |
| Standard Deviation (Sample) | 9.1% | 3.6% |
| Standard Deviation (Population) | 9.0% | 3.6% |
Demographics Similar to Immigrants from Thailand and Nonimmigrants by Disability Age 65 to 74
In terms of disability age 65 to 74, the demographic groups most similar to Immigrants from Thailand are Immigrants from Zaire (24.3%, a difference of 0.050%), Bahamian (24.4%, a difference of 0.21%), Panamanian (24.4%, a difference of 0.32%), Scotch-Irish (24.4%, a difference of 0.48%), and German Russian (24.4%, a difference of 0.52%). Similarly, the demographic groups most similar to Nonimmigrants are Salvadoran (25.0%, a difference of 0.20%), Immigrants from Fiji (25.0%, a difference of 0.22%), Senegalese (24.9%, a difference of 0.32%), Indonesian (24.9%, a difference of 0.57%), and Immigrants from Iraq (24.7%, a difference of 1.4%).
| Demographics | Rating | Rank | Disability Age 65 to 74 |
| Immigrants | Thailand | 5.2 /100 | #231 | Tragic 24.3% |
| Immigrants | Zaire | 5.0 /100 | #232 | Tragic 24.3% |
| Bahamians | 4.5 /100 | #233 | Tragic 24.4% |
| Panamanians | 4.2 /100 | #234 | Tragic 24.4% |
| Scotch-Irish | 3.8 /100 | #235 | Tragic 24.4% |
| German Russians | 3.7 /100 | #236 | Tragic 24.4% |
| West Indians | 3.4 /100 | #237 | Tragic 24.5% |
| Immigrants | Ghana | 3.0 /100 | #238 | Tragic 24.5% |
| Immigrants | Caribbean | 2.6 /100 | #239 | Tragic 24.6% |
| Spaniards | 2.4 /100 | #240 | Tragic 24.6% |
| Immigrants | Western Africa | 2.3 /100 | #241 | Tragic 24.6% |
| Immigrants | Senegal | 2.2 /100 | #242 | Tragic 24.6% |
| Spanish | 2.2 /100 | #243 | Tragic 24.6% |
| Armenians | 2.0 /100 | #244 | Tragic 24.7% |
| British West Indians | 2.0 /100 | #245 | Tragic 24.7% |
| Immigrants | Iraq | 1.9 /100 | #246 | Tragic 24.7% |
| Indonesians | 1.1 /100 | #247 | Tragic 24.9% |
| Senegalese | 0.9 /100 | #248 | Tragic 24.9% |
| Immigrants | Fiji | 0.8 /100 | #249 | Tragic 25.0% |
| Salvadorans | 0.8 /100 | #250 | Tragic 25.0% |
| Immigrants | Nonimmigrants | 0.7 /100 | #251 | Tragic 25.0% |