Ghanaian vs Nonimmigrants Disability Age 65 to 74
COMPARE
Ghanaian
Nonimmigrants
Disability Age 65 to 74
Disability Age 65 to 74 Comparison
Ghanaians
Nonimmigrants
24.1%
DISABILITY AGE 65 TO 74
10.4/ 100
METRIC RATING
220th/ 347
METRIC RANK
25.0%
DISABILITY AGE 65 TO 74
0.7/ 100
METRIC RATING
251st/ 347
METRIC RANK
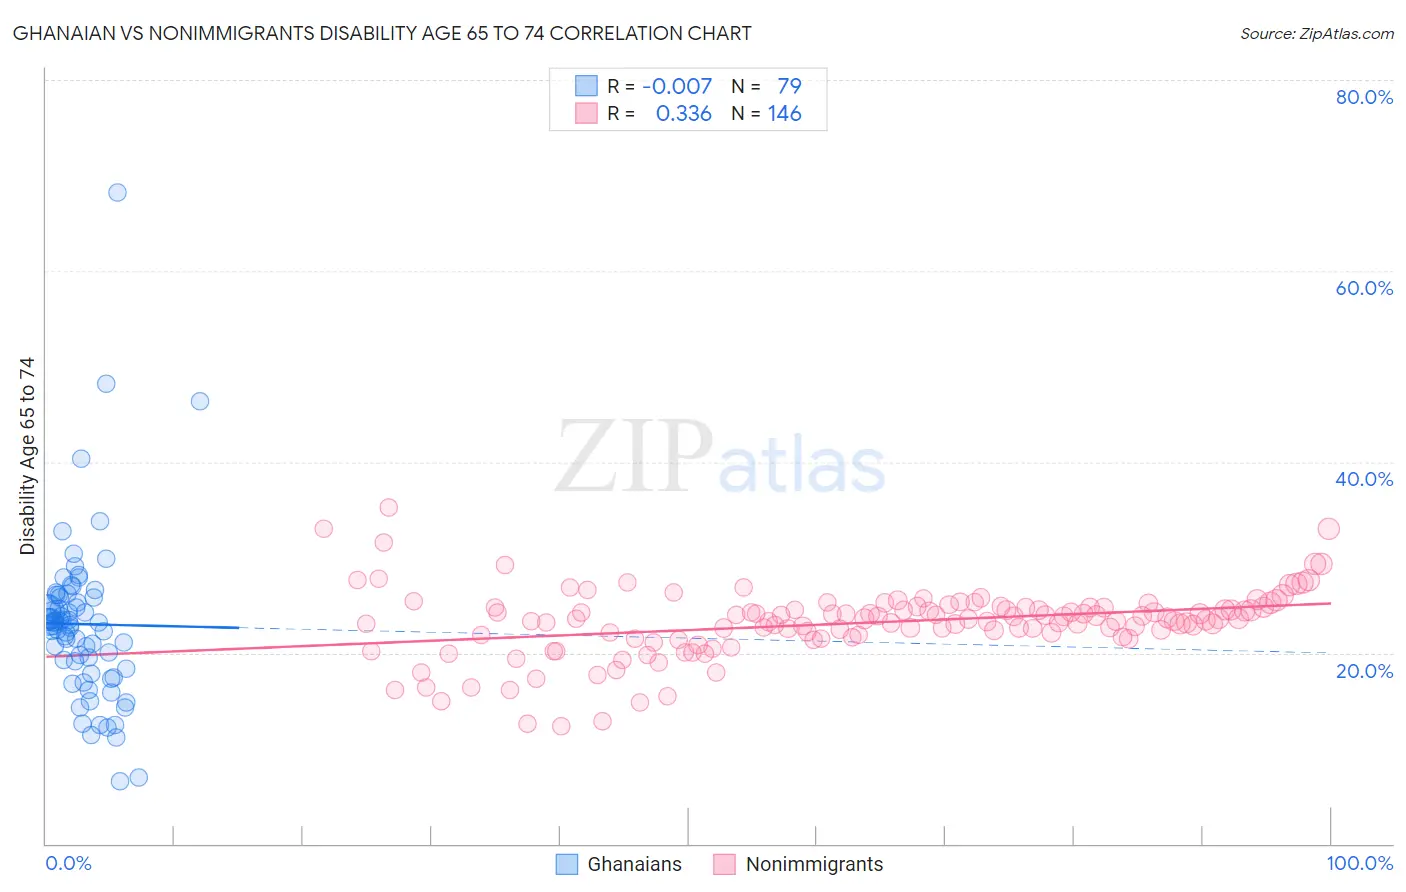
Ghanaian vs Nonimmigrants Disability Age 65 to 74 Correlation Chart
The statistical analysis conducted on geographies consisting of 190,307,829 people shows no correlation between the proportion of Ghanaians and percentage of population with a disability between the ages 65 and 75 in the United States with a correlation coefficient (R) of -0.007 and weighted average of 24.1%. Similarly, the statistical analysis conducted on geographies consisting of 581,657,399 people shows a mild positive correlation between the proportion of Nonimmigrants and percentage of population with a disability between the ages 65 and 75 in the United States with a correlation coefficient (R) of 0.336 and weighted average of 25.0%, a difference of 3.9%.
Disability Age 65 to 74 Correlation Summary
| Measurement | Ghanaian | Nonimmigrants |
| Minimum | 6.5% | 12.3% |
| Maximum | 68.3% | 35.2% |
| Range | 61.8% | 22.8% |
| Mean | 23.0% | 23.1% |
| Median | 22.9% | 23.5% |
| Interquartile 25% (IQ1) | 18.3% | 21.7% |
| Interquartile 75% (IQ3) | 25.9% | 24.8% |
| Interquartile Range (IQR) | 7.5% | 3.1% |
| Standard Deviation (Sample) | 8.8% | 3.6% |
| Standard Deviation (Population) | 8.7% | 3.6% |
Similar Demographics by Disability Age 65 to 74
Demographics Similar to Ghanaians by Disability Age 65 to 74
In terms of disability age 65 to 74, the demographic groups most similar to Ghanaians are Immigrants from Nicaragua (24.1%, a difference of 0.090%), Native Hawaiian (24.1%, a difference of 0.16%), Immigrants from Burma/Myanmar (24.0%, a difference of 0.18%), Immigrants from Portugal (24.0%, a difference of 0.19%), and Immigrants from Nigeria (24.0%, a difference of 0.19%).
| Demographics | Rating | Rank | Disability Age 65 to 74 |
| Nicaraguans | 14.3 /100 | #213 | Poor 23.9% |
| Immigrants | Oceania | 13.6 /100 | #214 | Poor 24.0% |
| Pennsylvania Germans | 13.3 /100 | #215 | Poor 24.0% |
| Jamaicans | 12.2 /100 | #216 | Poor 24.0% |
| Immigrants | Portugal | 11.7 /100 | #217 | Poor 24.0% |
| Immigrants | Nigeria | 11.7 /100 | #218 | Poor 24.0% |
| Immigrants | Burma/Myanmar | 11.6 /100 | #219 | Poor 24.0% |
| Ghanaians | 10.4 /100 | #220 | Poor 24.1% |
| Immigrants | Nicaragua | 9.8 /100 | #221 | Tragic 24.1% |
| Native Hawaiians | 9.3 /100 | #222 | Tragic 24.1% |
| Immigrants | Middle Africa | 8.9 /100 | #223 | Tragic 24.1% |
| Immigrants | Panama | 8.6 /100 | #224 | Tragic 24.1% |
| Bermudans | 8.2 /100 | #225 | Tragic 24.2% |
| Iraqis | 8.1 /100 | #226 | Tragic 24.2% |
| Nigerians | 7.8 /100 | #227 | Tragic 24.2% |
Demographics Similar to Nonimmigrants by Disability Age 65 to 74
In terms of disability age 65 to 74, the demographic groups most similar to Nonimmigrants are Immigrants from El Salvador (25.1%, a difference of 0.19%), Salvadoran (25.0%, a difference of 0.20%), Immigrants from Fiji (25.0%, a difference of 0.22%), Subsaharan African (25.1%, a difference of 0.23%), and Somali (25.1%, a difference of 0.30%).
| Demographics | Rating | Rank | Disability Age 65 to 74 |
| Armenians | 2.0 /100 | #244 | Tragic 24.7% |
| British West Indians | 2.0 /100 | #245 | Tragic 24.7% |
| Immigrants | Iraq | 1.9 /100 | #246 | Tragic 24.7% |
| Indonesians | 1.1 /100 | #247 | Tragic 24.9% |
| Senegalese | 0.9 /100 | #248 | Tragic 24.9% |
| Immigrants | Fiji | 0.8 /100 | #249 | Tragic 25.0% |
| Salvadorans | 0.8 /100 | #250 | Tragic 25.0% |
| Immigrants | Nonimmigrants | 0.7 /100 | #251 | Tragic 25.0% |
| Immigrants | El Salvador | 0.6 /100 | #252 | Tragic 25.1% |
| Sub-Saharan Africans | 0.6 /100 | #253 | Tragic 25.1% |
| Somalis | 0.6 /100 | #254 | Tragic 25.1% |
| Central Americans | 0.5 /100 | #255 | Tragic 25.1% |
| Immigrants | Somalia | 0.4 /100 | #256 | Tragic 25.2% |
| Guamanians/Chamorros | 0.3 /100 | #257 | Tragic 25.3% |
| Marshallese | 0.3 /100 | #258 | Tragic 25.3% |