French Canadian vs Yaqui Disability Age Under 5
COMPARE
French Canadian
Yaqui
Disability Age Under 5
Disability Age Under 5 Comparison
French Canadians
Yaqui
1.9%
DISABILITY AGE UNDER 5
0.0/ 100
METRIC RATING
331st/ 347
METRIC RANK
1.2%
DISABILITY AGE UNDER 5
74.8/ 100
METRIC RATING
151st/ 347
METRIC RANK
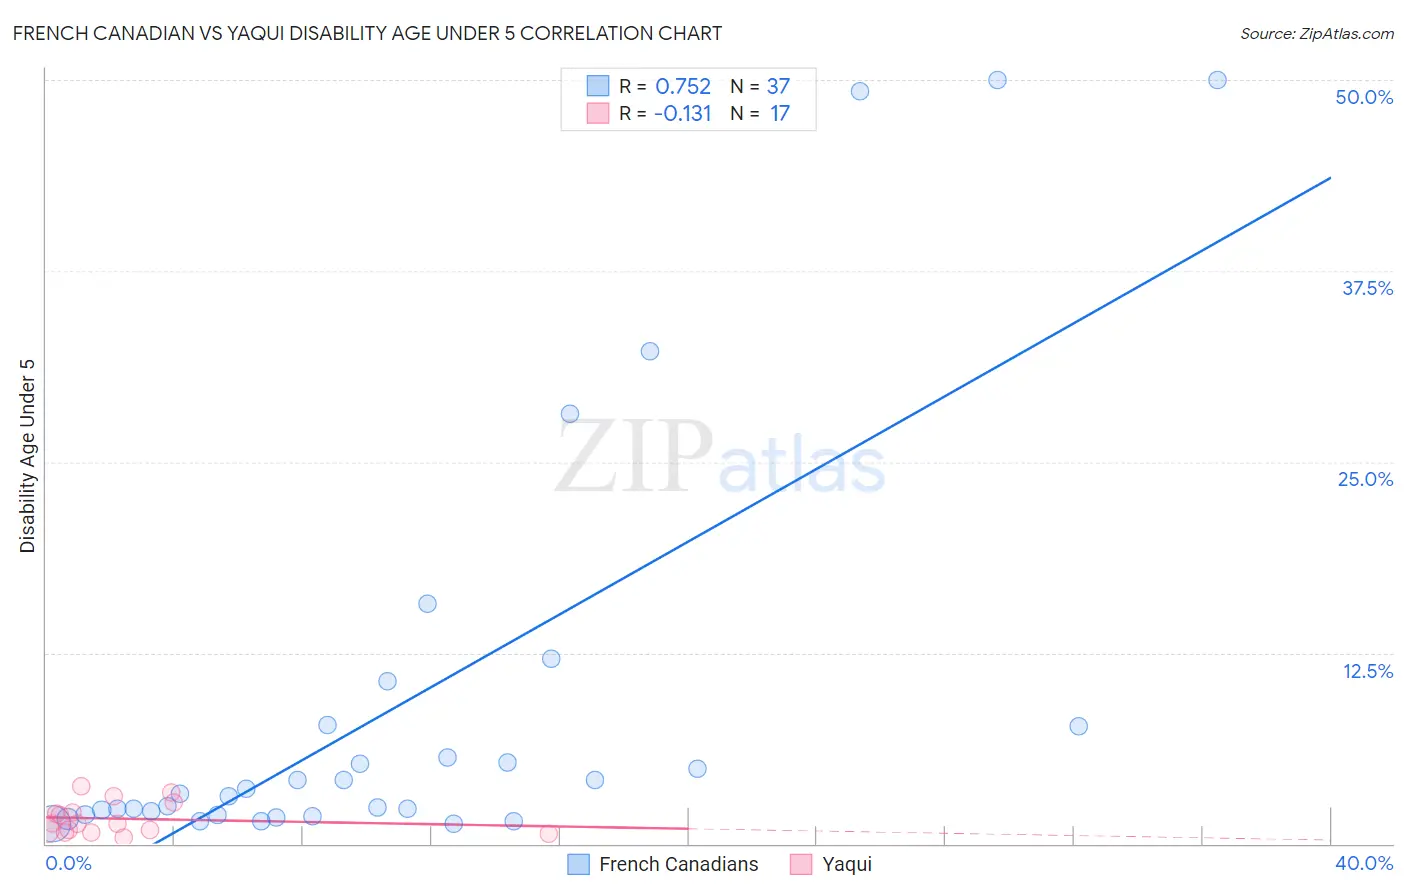
French Canadian vs Yaqui Disability Age Under 5 Correlation Chart
The statistical analysis conducted on geographies consisting of 244,253,201 people shows a strong positive correlation between the proportion of French Canadians and percentage of population with a disability under the age of 5 in the United States with a correlation coefficient (R) of 0.752 and weighted average of 1.9%. Similarly, the statistical analysis conducted on geographies consisting of 82,785,563 people shows a poor negative correlation between the proportion of Yaqui and percentage of population with a disability under the age of 5 in the United States with a correlation coefficient (R) of -0.131 and weighted average of 1.2%, a difference of 55.3%.
Disability Age Under 5 Correlation Summary
| Measurement | French Canadian | Yaqui |
| Minimum | 1.3% | 0.41% |
| Maximum | 50.0% | 3.8% |
| Range | 48.7% | 3.4% |
| Mean | 9.2% | 1.6% |
| Median | 3.3% | 1.3% |
| Interquartile 25% (IQ1) | 1.9% | 0.81% |
| Interquartile 75% (IQ3) | 7.7% | 2.4% |
| Interquartile Range (IQR) | 5.8% | 1.6% |
| Standard Deviation (Sample) | 14.0% | 1.0% |
| Standard Deviation (Population) | 13.8% | 1.0% |
Similar Demographics by Disability Age Under 5
Demographics Similar to French Canadians by Disability Age Under 5
In terms of disability age under 5, the demographic groups most similar to French Canadians are Chippewa (1.9%, a difference of 0.060%), Choctaw (1.9%, a difference of 0.30%), Houma (1.9%, a difference of 0.62%), American (1.9%, a difference of 1.1%), and Osage (1.8%, a difference of 2.8%).
| Demographics | Rating | Rank | Disability Age Under 5 |
| Cherokee | 0.0 /100 | #324 | Tragic 1.8% |
| Immigrants | Portugal | 0.0 /100 | #325 | Tragic 1.8% |
| Sioux | 0.0 /100 | #326 | Tragic 1.8% |
| Osage | 0.0 /100 | #327 | Tragic 1.8% |
| Americans | 0.0 /100 | #328 | Tragic 1.9% |
| Houma | 0.0 /100 | #329 | Tragic 1.9% |
| Choctaw | 0.0 /100 | #330 | Tragic 1.9% |
| French Canadians | 0.0 /100 | #331 | Tragic 1.9% |
| Chippewa | 0.0 /100 | #332 | Tragic 1.9% |
| Dutch West Indians | 0.0 /100 | #333 | Tragic 1.9% |
| Natives/Alaskans | 0.0 /100 | #334 | Tragic 1.9% |
| Pennsylvania Germans | 0.0 /100 | #335 | Tragic 1.9% |
| Paraguayans | 0.0 /100 | #336 | Tragic 2.0% |
| Apache | 0.0 /100 | #337 | Tragic 2.0% |
| Tohono O'odham | 0.0 /100 | #338 | Tragic 2.2% |
Demographics Similar to Yaqui by Disability Age Under 5
In terms of disability age under 5, the demographic groups most similar to Yaqui are South American (1.2%, a difference of 0.10%), Kenyan (1.2%, a difference of 0.14%), Ghanaian (1.2%, a difference of 0.19%), Icelander (1.2%, a difference of 0.20%), and Honduran (1.2%, a difference of 0.28%).
| Demographics | Rating | Rank | Disability Age Under 5 |
| Immigrants | Middle Africa | 79.3 /100 | #144 | Good 1.2% |
| Immigrants | Zimbabwe | 77.9 /100 | #145 | Good 1.2% |
| Samoans | 77.7 /100 | #146 | Good 1.2% |
| Icelanders | 76.3 /100 | #147 | Good 1.2% |
| Ghanaians | 76.3 /100 | #148 | Good 1.2% |
| Kenyans | 75.9 /100 | #149 | Good 1.2% |
| South Americans | 75.6 /100 | #150 | Good 1.2% |
| Yaqui | 74.8 /100 | #151 | Good 1.2% |
| Hondurans | 72.5 /100 | #152 | Good 1.2% |
| Immigrants | Thailand | 69.4 /100 | #153 | Good 1.2% |
| Uruguayans | 68.8 /100 | #154 | Good 1.2% |
| Immigrants | Ghana | 68.7 /100 | #155 | Good 1.2% |
| Hawaiians | 68.5 /100 | #156 | Good 1.2% |
| Immigrants | South America | 67.0 /100 | #157 | Good 1.2% |
| Arabs | 66.4 /100 | #158 | Good 1.2% |