Belgian vs Yaqui Disability Age Under 5
COMPARE
Belgian
Yaqui
Disability Age Under 5
Disability Age Under 5 Comparison
Belgians
Yaqui
1.4%
DISABILITY AGE UNDER 5
0.1/ 100
METRIC RATING
268th/ 347
METRIC RANK
1.2%
DISABILITY AGE UNDER 5
74.8/ 100
METRIC RATING
151st/ 347
METRIC RANK
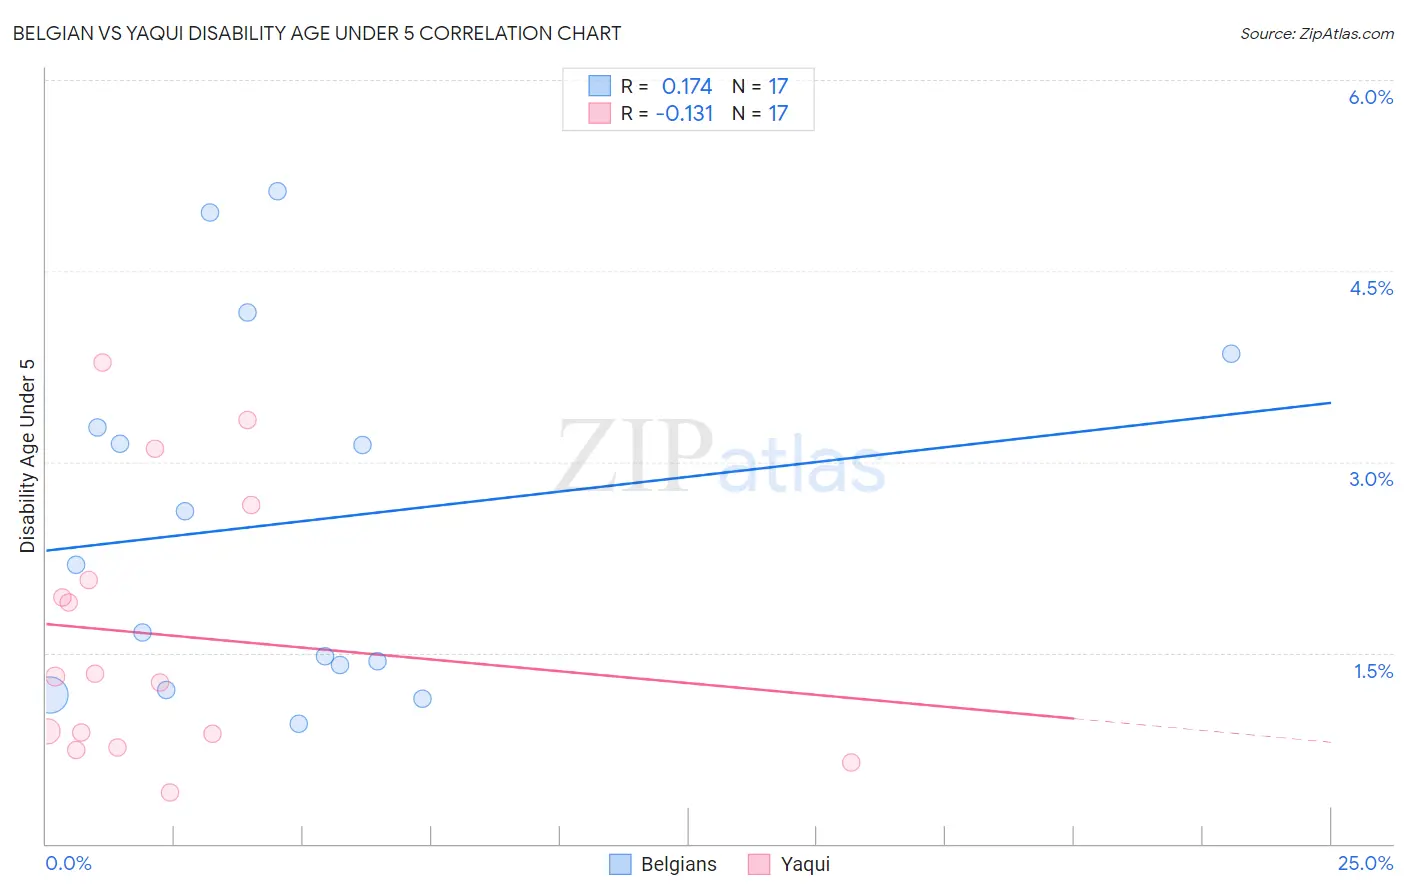
Belgian vs Yaqui Disability Age Under 5 Correlation Chart
The statistical analysis conducted on geographies consisting of 192,782,941 people shows a poor positive correlation between the proportion of Belgians and percentage of population with a disability under the age of 5 in the United States with a correlation coefficient (R) of 0.174 and weighted average of 1.4%. Similarly, the statistical analysis conducted on geographies consisting of 82,785,563 people shows a poor negative correlation between the proportion of Yaqui and percentage of population with a disability under the age of 5 in the United States with a correlation coefficient (R) of -0.131 and weighted average of 1.2%, a difference of 19.0%.
Disability Age Under 5 Correlation Summary
| Measurement | Belgian | Yaqui |
| Minimum | 0.94% | 0.41% |
| Maximum | 5.1% | 3.8% |
| Range | 4.2% | 3.4% |
| Mean | 2.5% | 1.6% |
| Median | 2.2% | 1.3% |
| Interquartile 25% (IQ1) | 1.3% | 0.81% |
| Interquartile 75% (IQ3) | 3.6% | 2.4% |
| Interquartile Range (IQR) | 2.3% | 1.6% |
| Standard Deviation (Sample) | 1.4% | 1.0% |
| Standard Deviation (Population) | 1.3% | 1.0% |
Similar Demographics by Disability Age Under 5
Demographics Similar to Belgians by Disability Age Under 5
In terms of disability age under 5, the demographic groups most similar to Belgians are Austrian (1.4%, a difference of 0.18%), Immigrants from North America (1.4%, a difference of 0.31%), Immigrants from Canada (1.4%, a difference of 0.35%), Black/African American (1.4%, a difference of 0.51%), and Cree (1.4%, a difference of 0.58%).
| Demographics | Rating | Rank | Disability Age Under 5 |
| Immigrants | Netherlands | 0.2 /100 | #261 | Tragic 1.4% |
| Immigrants | Dominica | 0.2 /100 | #262 | Tragic 1.4% |
| Spanish | 0.2 /100 | #263 | Tragic 1.4% |
| Yugoslavians | 0.1 /100 | #264 | Tragic 1.4% |
| Carpatho Rusyns | 0.1 /100 | #265 | Tragic 1.4% |
| Immigrants | Germany | 0.1 /100 | #266 | Tragic 1.4% |
| Cree | 0.1 /100 | #267 | Tragic 1.4% |
| Belgians | 0.1 /100 | #268 | Tragic 1.4% |
| Austrians | 0.1 /100 | #269 | Tragic 1.4% |
| Immigrants | North America | 0.1 /100 | #270 | Tragic 1.4% |
| Immigrants | Canada | 0.1 /100 | #271 | Tragic 1.4% |
| Blacks/African Americans | 0.1 /100 | #272 | Tragic 1.4% |
| Alaskan Athabascans | 0.1 /100 | #273 | Tragic 1.5% |
| Iroquois | 0.0 /100 | #274 | Tragic 1.5% |
| Brazilians | 0.0 /100 | #275 | Tragic 1.5% |
Demographics Similar to Yaqui by Disability Age Under 5
In terms of disability age under 5, the demographic groups most similar to Yaqui are South American (1.2%, a difference of 0.10%), Kenyan (1.2%, a difference of 0.14%), Ghanaian (1.2%, a difference of 0.19%), Icelander (1.2%, a difference of 0.20%), and Honduran (1.2%, a difference of 0.28%).
| Demographics | Rating | Rank | Disability Age Under 5 |
| Immigrants | Middle Africa | 79.3 /100 | #144 | Good 1.2% |
| Immigrants | Zimbabwe | 77.9 /100 | #145 | Good 1.2% |
| Samoans | 77.7 /100 | #146 | Good 1.2% |
| Icelanders | 76.3 /100 | #147 | Good 1.2% |
| Ghanaians | 76.3 /100 | #148 | Good 1.2% |
| Kenyans | 75.9 /100 | #149 | Good 1.2% |
| South Americans | 75.6 /100 | #150 | Good 1.2% |
| Yaqui | 74.8 /100 | #151 | Good 1.2% |
| Hondurans | 72.5 /100 | #152 | Good 1.2% |
| Immigrants | Thailand | 69.4 /100 | #153 | Good 1.2% |
| Uruguayans | 68.8 /100 | #154 | Good 1.2% |
| Immigrants | Ghana | 68.7 /100 | #155 | Good 1.2% |
| Hawaiians | 68.5 /100 | #156 | Good 1.2% |
| Immigrants | South America | 67.0 /100 | #157 | Good 1.2% |
| Arabs | 66.4 /100 | #158 | Good 1.2% |