Palestinian vs Immigrants from South Africa Disability Age 5 to 17
COMPARE
Palestinian
Immigrants from South Africa
Disability Age 5 to 17
Disability Age 5 to 17 Comparison
Palestinians
Immigrants from South Africa
5.2%
DISABILITY AGE 5 TO 17
99.8/ 100
METRIC RATING
66th/ 347
METRIC RANK
5.3%
DISABILITY AGE 5 TO 17
98.1/ 100
METRIC RATING
108th/ 347
METRIC RANK
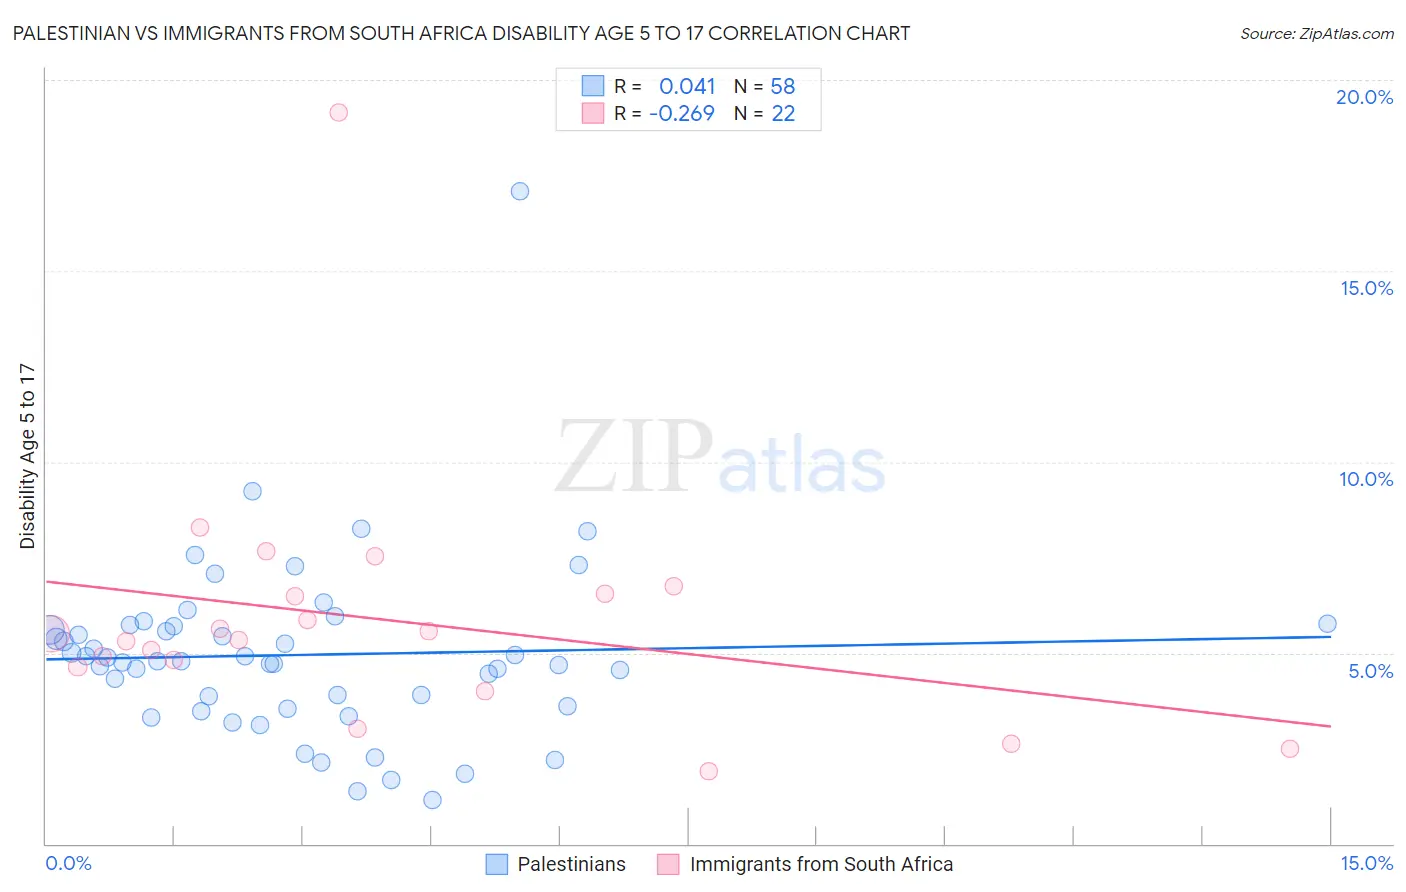
Palestinian vs Immigrants from South Africa Disability Age 5 to 17 Correlation Chart
The statistical analysis conducted on geographies consisting of 215,847,606 people shows no correlation between the proportion of Palestinians and percentage of population with a disability between the ages 5 and 17 in the United States with a correlation coefficient (R) of 0.041 and weighted average of 5.2%. Similarly, the statistical analysis conducted on geographies consisting of 231,812,836 people shows a weak negative correlation between the proportion of Immigrants from South Africa and percentage of population with a disability between the ages 5 and 17 in the United States with a correlation coefficient (R) of -0.269 and weighted average of 5.3%, a difference of 2.9%.
Disability Age 5 to 17 Correlation Summary
| Measurement | Palestinian | Immigrants from South Africa |
| Minimum | 1.1% | 1.9% |
| Maximum | 17.1% | 19.1% |
| Range | 15.9% | 17.3% |
| Mean | 4.9% | 5.9% |
| Median | 4.8% | 5.4% |
| Interquartile 25% (IQ1) | 3.6% | 4.6% |
| Interquartile 75% (IQ3) | 5.7% | 6.5% |
| Interquartile Range (IQR) | 2.1% | 1.9% |
| Standard Deviation (Sample) | 2.4% | 3.4% |
| Standard Deviation (Population) | 2.3% | 3.3% |
Similar Demographics by Disability Age 5 to 17
Demographics Similar to Palestinians by Disability Age 5 to 17
In terms of disability age 5 to 17, the demographic groups most similar to Palestinians are Macedonian (5.2%, a difference of 0.030%), Immigrants from Greece (5.2%, a difference of 0.040%), Immigrants from South Eastern Asia (5.2%, a difference of 0.060%), Immigrants from Bangladesh (5.2%, a difference of 0.090%), and Immigrants from Syria (5.2%, a difference of 0.17%).
| Demographics | Rating | Rank | Disability Age 5 to 17 |
| Immigrants | North Macedonia | 99.9 /100 | #59 | Exceptional 5.1% |
| Immigrants | Eastern Europe | 99.9 /100 | #60 | Exceptional 5.1% |
| Immigrants | Switzerland | 99.8 /100 | #61 | Exceptional 5.2% |
| Immigrants | Ireland | 99.8 /100 | #62 | Exceptional 5.2% |
| Immigrants | Bangladesh | 99.8 /100 | #63 | Exceptional 5.2% |
| Immigrants | South Eastern Asia | 99.8 /100 | #64 | Exceptional 5.2% |
| Immigrants | Greece | 99.8 /100 | #65 | Exceptional 5.2% |
| Palestinians | 99.8 /100 | #66 | Exceptional 5.2% |
| Macedonians | 99.8 /100 | #67 | Exceptional 5.2% |
| Immigrants | Syria | 99.7 /100 | #68 | Exceptional 5.2% |
| Guyanese | 99.7 /100 | #69 | Exceptional 5.2% |
| Immigrants | Belgium | 99.7 /100 | #70 | Exceptional 5.2% |
| Jordanians | 99.7 /100 | #71 | Exceptional 5.2% |
| Immigrants | Vietnam | 99.7 /100 | #72 | Exceptional 5.2% |
| Immigrants | Czechoslovakia | 99.7 /100 | #73 | Exceptional 5.2% |
Demographics Similar to Immigrants from South Africa by Disability Age 5 to 17
In terms of disability age 5 to 17, the demographic groups most similar to Immigrants from South Africa are Russian (5.3%, a difference of 0.040%), Immigrants from Northern Africa (5.3%, a difference of 0.040%), Immigrants from Yemen (5.3%, a difference of 0.070%), Immigrants from Eritrea (5.3%, a difference of 0.080%), and Ethiopian (5.3%, a difference of 0.12%).
| Demographics | Rating | Rank | Disability Age 5 to 17 |
| Menominee | 98.7 /100 | #101 | Exceptional 5.3% |
| Nicaraguans | 98.6 /100 | #102 | Exceptional 5.3% |
| Salvadorans | 98.6 /100 | #103 | Exceptional 5.3% |
| Peruvians | 98.5 /100 | #104 | Exceptional 5.3% |
| Immigrants | Italy | 98.4 /100 | #105 | Exceptional 5.3% |
| Immigrants | Yemen | 98.2 /100 | #106 | Exceptional 5.3% |
| Russians | 98.2 /100 | #107 | Exceptional 5.3% |
| Immigrants | South Africa | 98.1 /100 | #108 | Exceptional 5.3% |
| Immigrants | Northern Africa | 98.1 /100 | #109 | Exceptional 5.3% |
| Immigrants | Eritrea | 98.0 /100 | #110 | Exceptional 5.3% |
| Ethiopians | 97.9 /100 | #111 | Exceptional 5.3% |
| Immigrants | Latvia | 97.9 /100 | #112 | Exceptional 5.3% |
| Aleuts | 97.8 /100 | #113 | Exceptional 5.3% |
| Immigrants | Northern Europe | 97.8 /100 | #114 | Exceptional 5.3% |
| Cubans | 97.8 /100 | #115 | Exceptional 5.3% |