Palestinian vs Immigrants from India Ambulatory Disability
COMPARE
Palestinian
Immigrants from India
Ambulatory Disability
Ambulatory Disability Comparison
Palestinians
Immigrants from India
5.7%
AMBULATORY DISABILITY
99.2/ 100
METRIC RATING
82nd/ 347
METRIC RANK
4.8%
AMBULATORY DISABILITY
100.0/ 100
METRIC RATING
1st/ 347
METRIC RANK
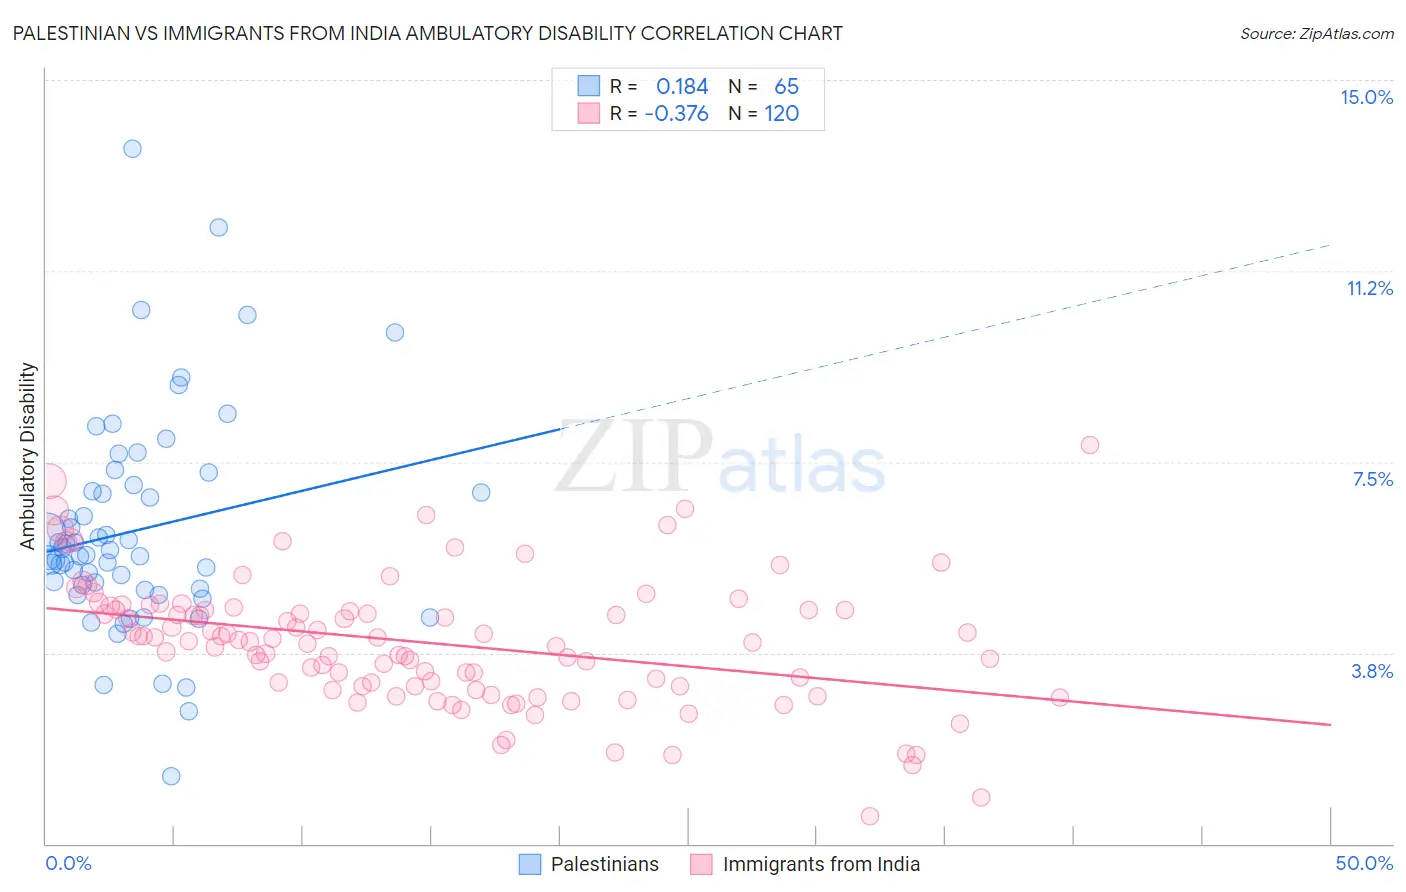
Palestinian vs Immigrants from India Ambulatory Disability Correlation Chart
The statistical analysis conducted on geographies consisting of 216,450,834 people shows a poor positive correlation between the proportion of Palestinians and percentage of population with ambulatory disability in the United States with a correlation coefficient (R) of 0.184 and weighted average of 5.7%. Similarly, the statistical analysis conducted on geographies consisting of 433,949,483 people shows a mild negative correlation between the proportion of Immigrants from India and percentage of population with ambulatory disability in the United States with a correlation coefficient (R) of -0.376 and weighted average of 4.8%, a difference of 20.2%.
Ambulatory Disability Correlation Summary
| Measurement | Palestinian | Immigrants from India |
| Minimum | 1.3% | 0.54% |
| Maximum | 13.7% | 7.8% |
| Range | 12.3% | 7.3% |
| Mean | 6.2% | 4.0% |
| Median | 5.7% | 4.0% |
| Interquartile 25% (IQ1) | 5.0% | 3.1% |
| Interquartile 75% (IQ3) | 7.0% | 4.6% |
| Interquartile Range (IQR) | 2.0% | 1.5% |
| Standard Deviation (Sample) | 2.1% | 1.3% |
| Standard Deviation (Population) | 2.1% | 1.2% |
Similar Demographics by Ambulatory Disability
Demographics Similar to Palestinians by Ambulatory Disability
In terms of ambulatory disability, the demographic groups most similar to Palestinians are Immigrants from Jordan (5.7%, a difference of 0.0%), Immigrants from Ireland (5.7%, a difference of 0.010%), Eastern European (5.7%, a difference of 0.020%), Ugandan (5.7%, a difference of 0.020%), and Chilean (5.7%, a difference of 0.14%).
| Demographics | Rating | Rank | Ambulatory Disability |
| Immigrants | South Africa | 99.3 /100 | #75 | Exceptional 5.7% |
| Sudanese | 99.3 /100 | #76 | Exceptional 5.7% |
| Immigrants | Vietnam | 99.3 /100 | #77 | Exceptional 5.7% |
| Somalis | 99.2 /100 | #78 | Exceptional 5.7% |
| Chileans | 99.2 /100 | #79 | Exceptional 5.7% |
| Immigrants | Ireland | 99.2 /100 | #80 | Exceptional 5.7% |
| Immigrants | Jordan | 99.2 /100 | #81 | Exceptional 5.7% |
| Palestinians | 99.2 /100 | #82 | Exceptional 5.7% |
| Eastern Europeans | 99.2 /100 | #83 | Exceptional 5.7% |
| Ugandans | 99.2 /100 | #84 | Exceptional 5.7% |
| South Americans | 99.0 /100 | #85 | Exceptional 5.7% |
| Latvians | 99.0 /100 | #86 | Exceptional 5.7% |
| Immigrants | Chile | 98.9 /100 | #87 | Exceptional 5.8% |
| Soviet Union | 98.9 /100 | #88 | Exceptional 5.8% |
| Bhutanese | 98.8 /100 | #89 | Exceptional 5.8% |
Demographics Similar to Immigrants from India by Ambulatory Disability
In terms of ambulatory disability, the demographic groups most similar to Immigrants from India are Filipino (4.9%, a difference of 2.0%), Thai (4.9%, a difference of 3.2%), Immigrants from Taiwan (4.9%, a difference of 3.5%), Immigrants from Singapore (5.0%, a difference of 4.9%), and Immigrants from Bolivia (5.0%, a difference of 5.7%).
| Demographics | Rating | Rank | Ambulatory Disability |
| Immigrants | India | 100.0 /100 | #1 | Exceptional 4.8% |
| Filipinos | 100.0 /100 | #2 | Exceptional 4.9% |
| Thais | 100.0 /100 | #3 | Exceptional 4.9% |
| Immigrants | Taiwan | 100.0 /100 | #4 | Exceptional 4.9% |
| Immigrants | Singapore | 100.0 /100 | #5 | Exceptional 5.0% |
| Immigrants | Bolivia | 100.0 /100 | #6 | Exceptional 5.0% |
| Bolivians | 100.0 /100 | #7 | Exceptional 5.1% |
| Immigrants | South Central Asia | 100.0 /100 | #8 | Exceptional 5.1% |
| Iranians | 100.0 /100 | #9 | Exceptional 5.1% |
| Yup'ik | 100.0 /100 | #10 | Exceptional 5.2% |
| Immigrants | Korea | 100.0 /100 | #11 | Exceptional 5.2% |
| Okinawans | 100.0 /100 | #12 | Exceptional 5.3% |
| Burmese | 100.0 /100 | #13 | Exceptional 5.3% |
| Immigrants | Eastern Asia | 100.0 /100 | #14 | Exceptional 5.3% |
| Immigrants | China | 100.0 /100 | #15 | Exceptional 5.3% |