Pakistani vs Immigrants from St. Vincent and the Grenadines Cognitive Disability
COMPARE
Pakistani
Immigrants from St. Vincent and the Grenadines
Cognitive Disability
Cognitive Disability Comparison
Pakistanis
Immigrants from St. Vincent and the Grenadines
17.3%
COGNITIVE DISABILITY
43.9/ 100
METRIC RATING
180th/ 347
METRIC RANK
17.7%
COGNITIVE DISABILITY
2.6/ 100
METRIC RATING
227th/ 347
METRIC RANK
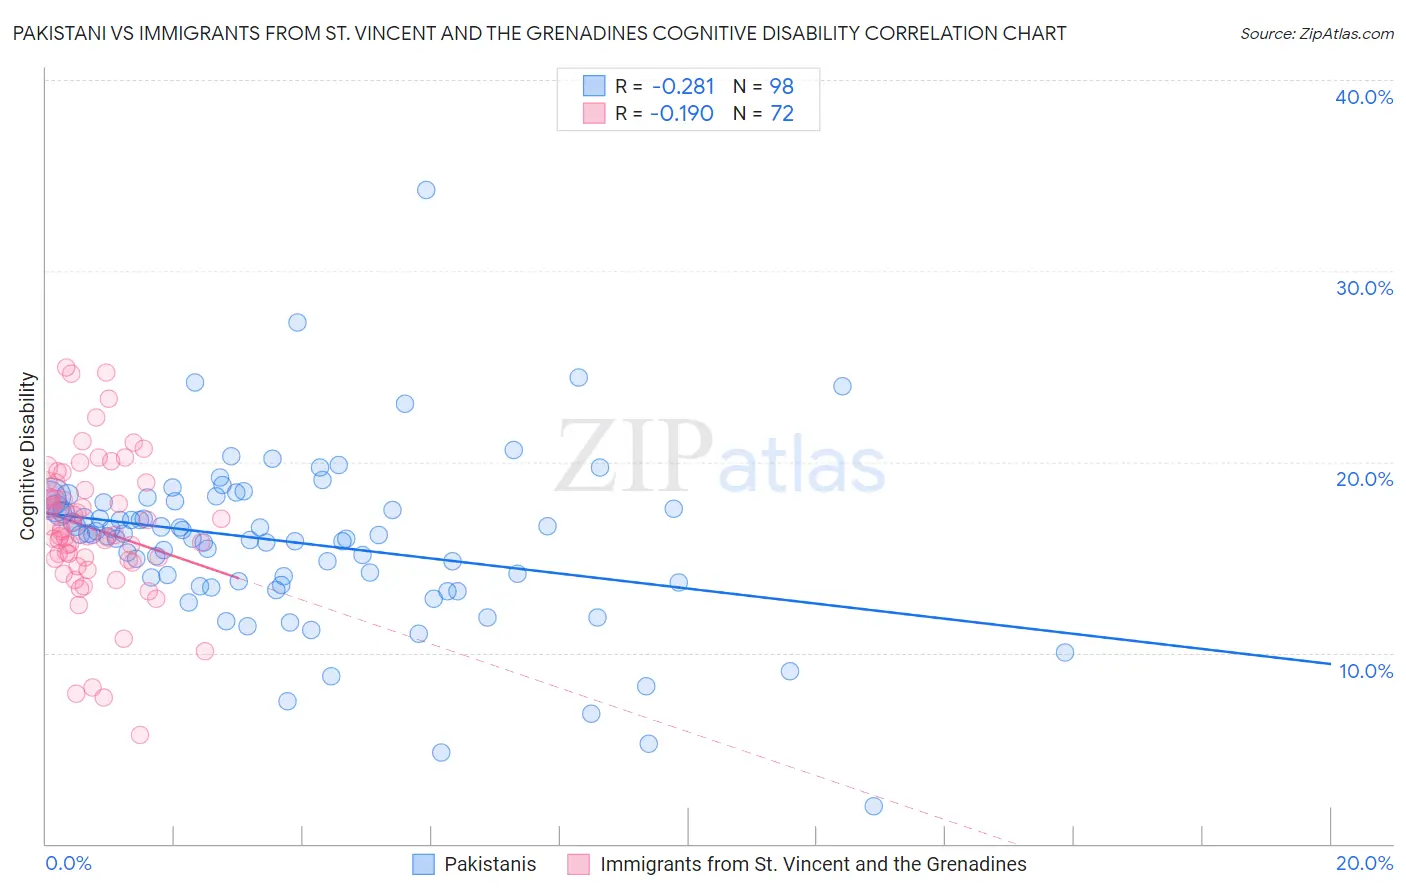
Pakistani vs Immigrants from St. Vincent and the Grenadines Cognitive Disability Correlation Chart
The statistical analysis conducted on geographies consisting of 335,302,267 people shows a weak negative correlation between the proportion of Pakistanis and percentage of population with cognitive disability in the United States with a correlation coefficient (R) of -0.281 and weighted average of 17.3%. Similarly, the statistical analysis conducted on geographies consisting of 56,191,582 people shows a poor negative correlation between the proportion of Immigrants from St. Vincent and the Grenadines and percentage of population with cognitive disability in the United States with a correlation coefficient (R) of -0.190 and weighted average of 17.7%, a difference of 2.4%.
Cognitive Disability Correlation Summary
| Measurement | Pakistani | Immigrants from St. Vincent and the Grenadines |
| Minimum | 2.0% | 5.7% |
| Maximum | 34.2% | 24.9% |
| Range | 32.2% | 19.3% |
| Mean | 15.8% | 16.5% |
| Median | 16.2% | 16.3% |
| Interquartile 25% (IQ1) | 13.7% | 14.9% |
| Interquartile 75% (IQ3) | 17.9% | 18.7% |
| Interquartile Range (IQR) | 4.2% | 3.8% |
| Standard Deviation (Sample) | 4.5% | 3.7% |
| Standard Deviation (Population) | 4.4% | 3.7% |
Similar Demographics by Cognitive Disability
Demographics Similar to Pakistanis by Cognitive Disability
In terms of cognitive disability, the demographic groups most similar to Pakistanis are Immigrants from Guyana (17.3%, a difference of 0.030%), Arab (17.3%, a difference of 0.030%), Spaniard (17.3%, a difference of 0.10%), Sioux (17.3%, a difference of 0.13%), and Spanish (17.3%, a difference of 0.14%).
| Demographics | Rating | Rank | Cognitive Disability |
| Immigrants | Northern Africa | 50.2 /100 | #173 | Average 17.3% |
| Laotians | 50.0 /100 | #174 | Average 17.3% |
| Tsimshian | 49.8 /100 | #175 | Average 17.3% |
| Shoshone | 49.2 /100 | #176 | Average 17.3% |
| Ute | 49.1 /100 | #177 | Average 17.3% |
| Spanish | 48.9 /100 | #178 | Average 17.3% |
| Sioux | 48.6 /100 | #179 | Average 17.3% |
| Pakistanis | 43.9 /100 | #180 | Average 17.3% |
| Immigrants | Guyana | 42.9 /100 | #181 | Average 17.3% |
| Arabs | 42.8 /100 | #182 | Average 17.3% |
| Spaniards | 40.3 /100 | #183 | Average 17.3% |
| Crow | 39.1 /100 | #184 | Fair 17.3% |
| Afghans | 38.2 /100 | #185 | Fair 17.3% |
| Cambodians | 35.9 /100 | #186 | Fair 17.3% |
| Immigrants | Fiji | 33.7 /100 | #187 | Fair 17.4% |
Demographics Similar to Immigrants from St. Vincent and the Grenadines by Cognitive Disability
In terms of cognitive disability, the demographic groups most similar to Immigrants from St. Vincent and the Grenadines are Marshallese (17.7%, a difference of 0.030%), Immigrants from Central America (17.7%, a difference of 0.080%), Immigrants from Guatemala (17.7%, a difference of 0.10%), Mongolian (17.7%, a difference of 0.13%), and Guatemalan (17.8%, a difference of 0.16%).
| Demographics | Rating | Rank | Cognitive Disability |
| Zimbabweans | 6.1 /100 | #220 | Tragic 17.6% |
| Moroccans | 5.9 /100 | #221 | Tragic 17.6% |
| Central Americans | 4.5 /100 | #222 | Tragic 17.7% |
| Alsatians | 4.5 /100 | #223 | Tragic 17.7% |
| Fijians | 3.4 /100 | #224 | Tragic 17.7% |
| Vietnamese | 3.4 /100 | #225 | Tragic 17.7% |
| Marshallese | 2.7 /100 | #226 | Tragic 17.7% |
| Immigrants | St. Vincent and the Grenadines | 2.6 /100 | #227 | Tragic 17.7% |
| Immigrants | Central America | 2.3 /100 | #228 | Tragic 17.7% |
| Immigrants | Guatemala | 2.2 /100 | #229 | Tragic 17.7% |
| Mongolians | 2.2 /100 | #230 | Tragic 17.7% |
| Guatemalans | 2.1 /100 | #231 | Tragic 17.8% |
| Tongans | 2.1 /100 | #232 | Tragic 17.8% |
| Panamanians | 2.1 /100 | #233 | Tragic 17.8% |
| Osage | 2.0 /100 | #234 | Tragic 17.8% |