Haitian vs Central American Cognitive Disability
COMPARE
Haitian
Central American
Cognitive Disability
Cognitive Disability Comparison
Haitians
Central Americans
17.5%
COGNITIVE DISABILITY
14.1/ 100
METRIC RATING
200th/ 347
METRIC RANK
17.7%
COGNITIVE DISABILITY
4.5/ 100
METRIC RATING
222nd/ 347
METRIC RANK
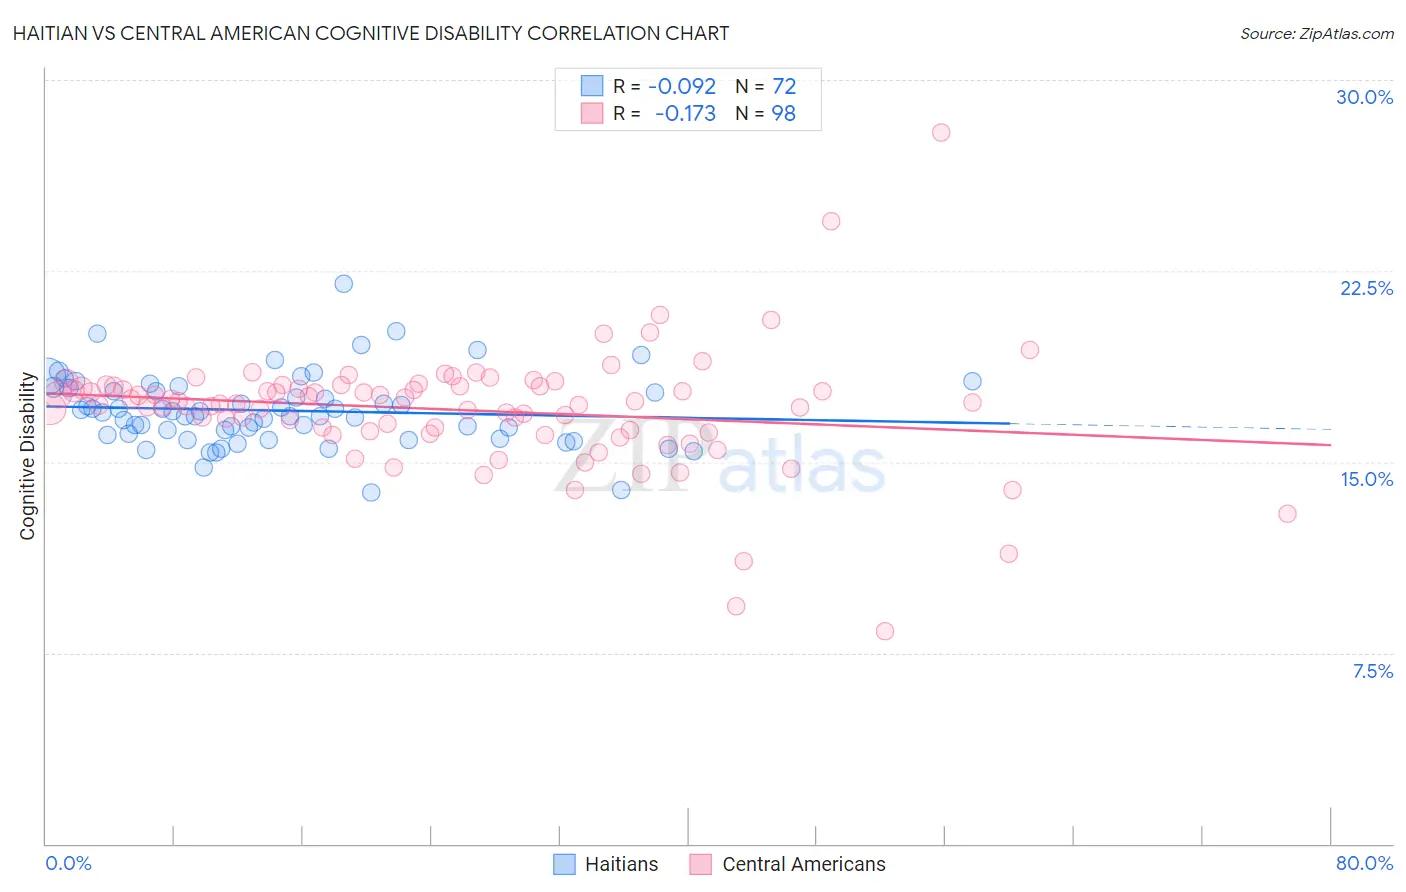
Haitian vs Central American Cognitive Disability Correlation Chart
The statistical analysis conducted on geographies consisting of 287,929,830 people shows a slight negative correlation between the proportion of Haitians and percentage of population with cognitive disability in the United States with a correlation coefficient (R) of -0.092 and weighted average of 17.5%. Similarly, the statistical analysis conducted on geographies consisting of 504,492,457 people shows a poor negative correlation between the proportion of Central Americans and percentage of population with cognitive disability in the United States with a correlation coefficient (R) of -0.173 and weighted average of 17.7%, a difference of 0.87%.
Cognitive Disability Correlation Summary
| Measurement | Haitian | Central American |
| Minimum | 13.8% | 8.3% |
| Maximum | 22.0% | 27.9% |
| Range | 8.2% | 19.6% |
| Mean | 17.0% | 17.0% |
| Median | 16.9% | 17.3% |
| Interquartile 25% (IQ1) | 16.1% | 16.2% |
| Interquartile 75% (IQ3) | 17.8% | 18.0% |
| Interquartile Range (IQR) | 1.8% | 1.8% |
| Standard Deviation (Sample) | 1.4% | 2.4% |
| Standard Deviation (Population) | 1.4% | 2.4% |
Similar Demographics by Cognitive Disability
Demographics Similar to Haitians by Cognitive Disability
In terms of cognitive disability, the demographic groups most similar to Haitians are Immigrants from Singapore (17.5%, a difference of 0.010%), Immigrants from Panama (17.5%, a difference of 0.040%), South American Indian (17.5%, a difference of 0.070%), Immigrants from Morocco (17.5%, a difference of 0.13%), and Immigrants from Afghanistan (17.5%, a difference of 0.14%).
| Demographics | Rating | Rank | Cognitive Disability |
| Delaware | 25.6 /100 | #193 | Fair 17.4% |
| Immigrants | Bosnia and Herzegovina | 22.0 /100 | #194 | Fair 17.4% |
| New Zealanders | 21.1 /100 | #195 | Fair 17.4% |
| Guyanese | 17.5 /100 | #196 | Poor 17.5% |
| Immigrants | Afghanistan | 16.7 /100 | #197 | Poor 17.5% |
| Immigrants | Panama | 14.8 /100 | #198 | Poor 17.5% |
| Immigrants | Singapore | 14.3 /100 | #199 | Poor 17.5% |
| Haitians | 14.1 /100 | #200 | Poor 17.5% |
| South American Indians | 13.0 /100 | #201 | Poor 17.5% |
| Immigrants | Morocco | 12.0 /100 | #202 | Poor 17.5% |
| Immigrants | Caribbean | 11.0 /100 | #203 | Poor 17.5% |
| Immigrants | Zimbabwe | 11.0 /100 | #204 | Poor 17.5% |
| Puget Sound Salish | 10.9 /100 | #205 | Poor 17.5% |
| Alaska Natives | 10.4 /100 | #206 | Poor 17.5% |
| Immigrants | Latin America | 9.7 /100 | #207 | Tragic 17.6% |
Demographics Similar to Central Americans by Cognitive Disability
In terms of cognitive disability, the demographic groups most similar to Central Americans are Alsatian (17.7%, a difference of 0.010%), Moroccan (17.6%, a difference of 0.20%), Fijian (17.7%, a difference of 0.20%), Vietnamese (17.7%, a difference of 0.21%), and Zimbabwean (17.6%, a difference of 0.22%).
| Demographics | Rating | Rank | Cognitive Disability |
| Alaskan Athabascans | 6.9 /100 | #215 | Tragic 17.6% |
| Okinawans | 6.8 /100 | #216 | Tragic 17.6% |
| Salvadorans | 6.7 /100 | #217 | Tragic 17.6% |
| Icelanders | 6.4 /100 | #218 | Tragic 17.6% |
| Immigrants | Sierra Leone | 6.3 /100 | #219 | Tragic 17.6% |
| Zimbabweans | 6.1 /100 | #220 | Tragic 17.6% |
| Moroccans | 5.9 /100 | #221 | Tragic 17.6% |
| Central Americans | 4.5 /100 | #222 | Tragic 17.7% |
| Alsatians | 4.5 /100 | #223 | Tragic 17.7% |
| Fijians | 3.4 /100 | #224 | Tragic 17.7% |
| Vietnamese | 3.4 /100 | #225 | Tragic 17.7% |
| Marshallese | 2.7 /100 | #226 | Tragic 17.7% |
| Immigrants | St. Vincent and the Grenadines | 2.6 /100 | #227 | Tragic 17.7% |
| Immigrants | Central America | 2.3 /100 | #228 | Tragic 17.7% |
| Immigrants | Guatemala | 2.2 /100 | #229 | Tragic 17.7% |