Spanish American Indian vs Central American Cognitive Disability
COMPARE
Spanish American Indian
Central American
Cognitive Disability
Cognitive Disability Comparison
Spanish American Indians
Central Americans
17.8%
COGNITIVE DISABILITY
2.0/ 100
METRIC RATING
235th/ 347
METRIC RANK
17.7%
COGNITIVE DISABILITY
4.5/ 100
METRIC RATING
222nd/ 347
METRIC RANK
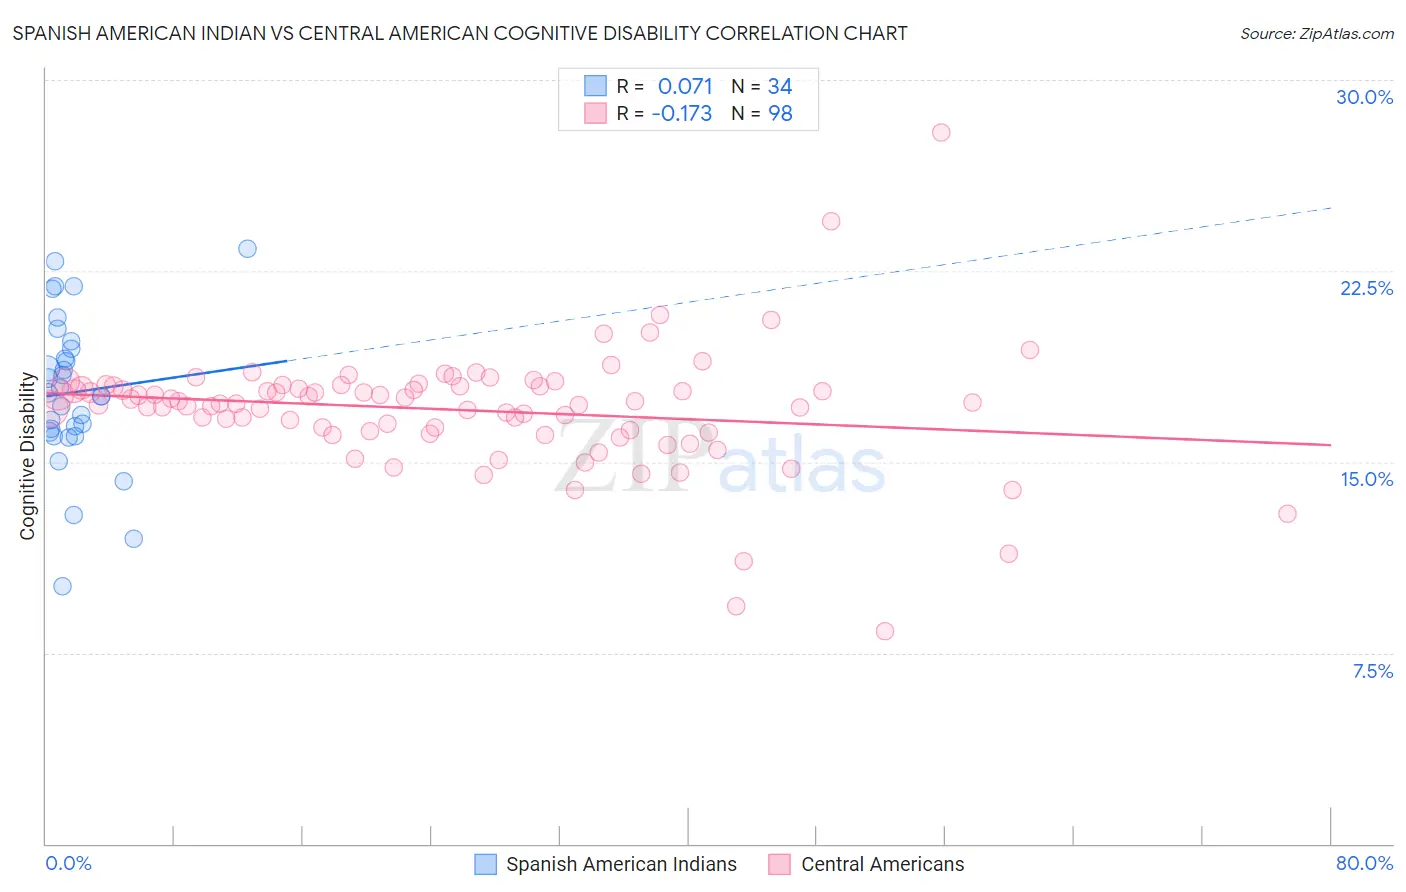
Spanish American Indian vs Central American Cognitive Disability Correlation Chart
The statistical analysis conducted on geographies consisting of 73,150,113 people shows a slight positive correlation between the proportion of Spanish American Indians and percentage of population with cognitive disability in the United States with a correlation coefficient (R) of 0.071 and weighted average of 17.8%. Similarly, the statistical analysis conducted on geographies consisting of 504,492,457 people shows a poor negative correlation between the proportion of Central Americans and percentage of population with cognitive disability in the United States with a correlation coefficient (R) of -0.173 and weighted average of 17.7%, a difference of 0.59%.
Cognitive Disability Correlation Summary
| Measurement | Spanish American Indian | Central American |
| Minimum | 10.1% | 8.3% |
| Maximum | 23.4% | 27.9% |
| Range | 13.2% | 19.6% |
| Mean | 17.7% | 17.0% |
| Median | 17.6% | 17.3% |
| Interquartile 25% (IQ1) | 16.2% | 16.2% |
| Interquartile 75% (IQ3) | 19.4% | 18.0% |
| Interquartile Range (IQR) | 3.3% | 1.8% |
| Standard Deviation (Sample) | 3.0% | 2.4% |
| Standard Deviation (Population) | 2.9% | 2.4% |
Demographics Similar to Spanish American Indians and Central Americans by Cognitive Disability
In terms of cognitive disability, the demographic groups most similar to Spanish American Indians are Osage (17.8%, a difference of 0.0%), Guatemalan (17.8%, a difference of 0.020%), Tongan (17.8%, a difference of 0.020%), Panamanian (17.8%, a difference of 0.020%), and Mongolian (17.7%, a difference of 0.060%). Similarly, the demographic groups most similar to Central Americans are Alsatian (17.7%, a difference of 0.010%), Moroccan (17.6%, a difference of 0.20%), Fijian (17.7%, a difference of 0.20%), Vietnamese (17.7%, a difference of 0.21%), and Zimbabwean (17.6%, a difference of 0.22%).
| Demographics | Rating | Rank | Cognitive Disability |
| Icelanders | 6.4 /100 | #218 | Tragic 17.6% |
| Immigrants | Sierra Leone | 6.3 /100 | #219 | Tragic 17.6% |
| Zimbabweans | 6.1 /100 | #220 | Tragic 17.6% |
| Moroccans | 5.9 /100 | #221 | Tragic 17.6% |
| Central Americans | 4.5 /100 | #222 | Tragic 17.7% |
| Alsatians | 4.5 /100 | #223 | Tragic 17.7% |
| Fijians | 3.4 /100 | #224 | Tragic 17.7% |
| Vietnamese | 3.4 /100 | #225 | Tragic 17.7% |
| Marshallese | 2.7 /100 | #226 | Tragic 17.7% |
| Immigrants | St. Vincent and the Grenadines | 2.6 /100 | #227 | Tragic 17.7% |
| Immigrants | Central America | 2.3 /100 | #228 | Tragic 17.7% |
| Immigrants | Guatemala | 2.2 /100 | #229 | Tragic 17.7% |
| Mongolians | 2.2 /100 | #230 | Tragic 17.7% |
| Guatemalans | 2.1 /100 | #231 | Tragic 17.8% |
| Tongans | 2.1 /100 | #232 | Tragic 17.8% |
| Panamanians | 2.1 /100 | #233 | Tragic 17.8% |
| Osage | 2.0 /100 | #234 | Tragic 17.8% |
| Spanish American Indians | 2.0 /100 | #235 | Tragic 17.8% |
| Immigrants | Iraq | 1.8 /100 | #236 | Tragic 17.8% |
| Immigrants | Mexico | 1.8 /100 | #237 | Tragic 17.8% |
| Cheyenne | 1.7 /100 | #238 | Tragic 17.8% |