Paiute vs Syrian Cognitive Disability
COMPARE
Paiute
Syrian
Cognitive Disability
Cognitive Disability Comparison
Paiute
Syrians
17.8%
COGNITIVE DISABILITY
1.1/ 100
METRIC RATING
242nd/ 347
METRIC RANK
17.1%
COGNITIVE DISABILITY
83.0/ 100
METRIC RATING
151st/ 347
METRIC RANK
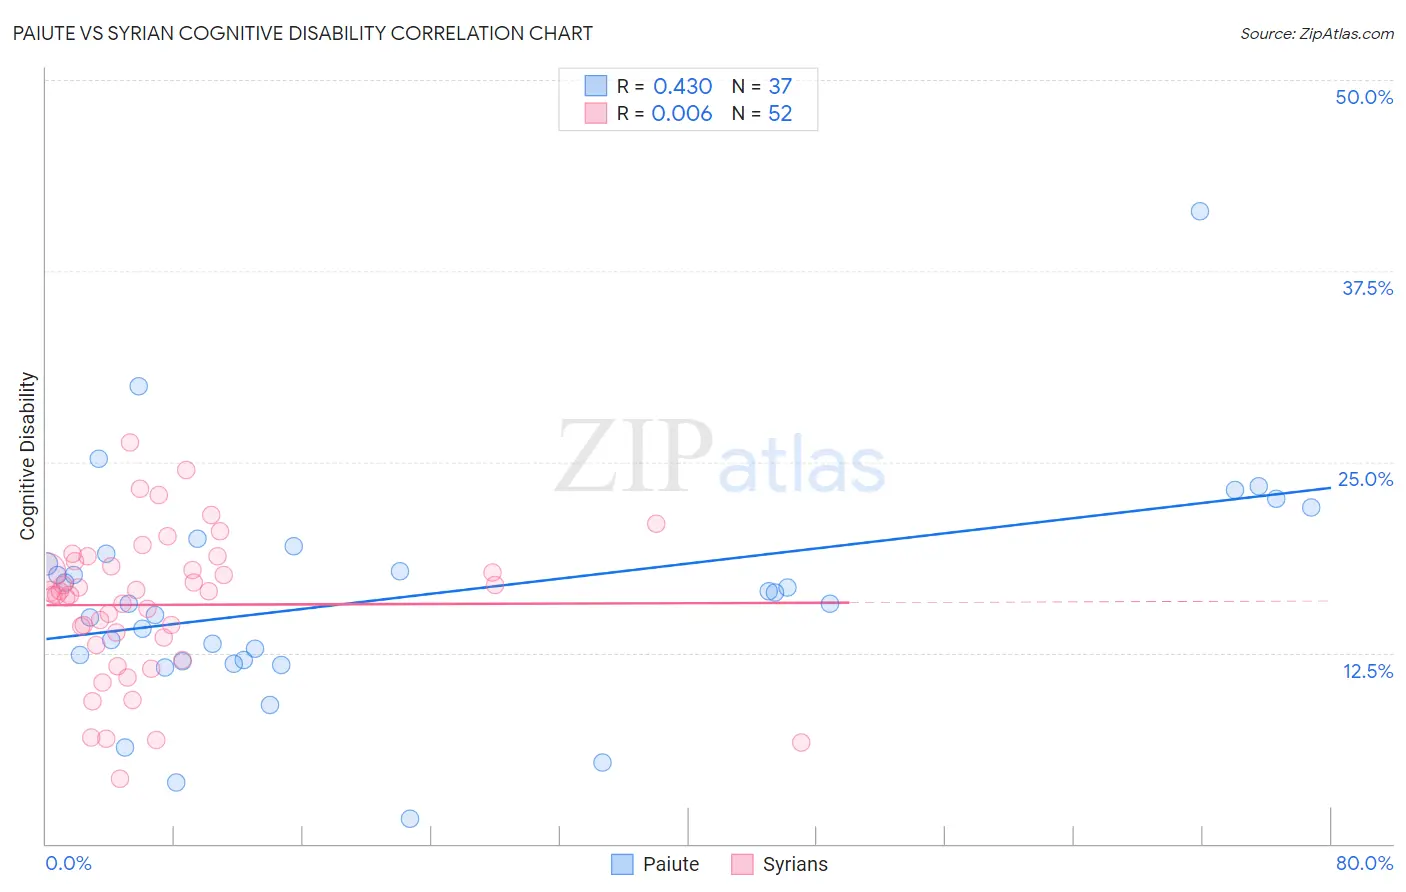
Paiute vs Syrian Cognitive Disability Correlation Chart
The statistical analysis conducted on geographies consisting of 58,394,773 people shows a moderate positive correlation between the proportion of Paiute and percentage of population with cognitive disability in the United States with a correlation coefficient (R) of 0.430 and weighted average of 17.8%. Similarly, the statistical analysis conducted on geographies consisting of 266,316,682 people shows no correlation between the proportion of Syrians and percentage of population with cognitive disability in the United States with a correlation coefficient (R) of 0.006 and weighted average of 17.1%, a difference of 4.4%.
Cognitive Disability Correlation Summary
| Measurement | Paiute | Syrian |
| Minimum | 1.6% | 4.2% |
| Maximum | 41.4% | 26.3% |
| Range | 39.8% | 22.0% |
| Mean | 16.1% | 15.6% |
| Median | 15.8% | 16.4% |
| Interquartile 25% (IQ1) | 12.0% | 13.2% |
| Interquartile 75% (IQ3) | 19.2% | 18.3% |
| Interquartile Range (IQR) | 7.2% | 5.1% |
| Standard Deviation (Sample) | 7.3% | 4.7% |
| Standard Deviation (Population) | 7.2% | 4.7% |
Similar Demographics by Cognitive Disability
Demographics Similar to Paiute by Cognitive Disability
In terms of cognitive disability, the demographic groups most similar to Paiute are Mexican (17.8%, a difference of 0.020%), Immigrants from Bangladesh (17.8%, a difference of 0.070%), Jamaican (17.9%, a difference of 0.11%), Iraqi (17.8%, a difference of 0.16%), and Cajun (17.8%, a difference of 0.19%).
| Demographics | Rating | Rank | Cognitive Disability |
| Spanish American Indians | 2.0 /100 | #235 | Tragic 17.8% |
| Immigrants | Iraq | 1.8 /100 | #236 | Tragic 17.8% |
| Immigrants | Mexico | 1.8 /100 | #237 | Tragic 17.8% |
| Cheyenne | 1.7 /100 | #238 | Tragic 17.8% |
| Cajuns | 1.4 /100 | #239 | Tragic 17.8% |
| Iraqis | 1.4 /100 | #240 | Tragic 17.8% |
| Mexicans | 1.1 /100 | #241 | Tragic 17.8% |
| Paiute | 1.1 /100 | #242 | Tragic 17.8% |
| Immigrants | Bangladesh | 1.0 /100 | #243 | Tragic 17.8% |
| Jamaicans | 0.9 /100 | #244 | Tragic 17.9% |
| Trinidadians and Tobagonians | 0.8 /100 | #245 | Tragic 17.9% |
| Immigrants | Thailand | 0.8 /100 | #246 | Tragic 17.9% |
| Samoans | 0.7 /100 | #247 | Tragic 17.9% |
| French American Indians | 0.7 /100 | #248 | Tragic 17.9% |
| Cree | 0.7 /100 | #249 | Tragic 17.9% |
Demographics Similar to Syrians by Cognitive Disability
In terms of cognitive disability, the demographic groups most similar to Syrians are Immigrants from Indonesia (17.1%, a difference of 0.020%), Immigrants from Kazakhstan (17.1%, a difference of 0.12%), Basque (17.1%, a difference of 0.13%), French Canadian (17.1%, a difference of 0.15%), and Cypriot (17.1%, a difference of 0.15%).
| Demographics | Rating | Rank | Cognitive Disability |
| Immigrants | Brazil | 89.3 /100 | #144 | Excellent 17.0% |
| Immigrants | South Eastern Asia | 88.7 /100 | #145 | Excellent 17.0% |
| Costa Ricans | 88.0 /100 | #146 | Excellent 17.0% |
| Scotch-Irish | 85.9 /100 | #147 | Excellent 17.1% |
| French Canadians | 85.7 /100 | #148 | Excellent 17.1% |
| Cypriots | 85.7 /100 | #149 | Excellent 17.1% |
| Basques | 85.5 /100 | #150 | Excellent 17.1% |
| Syrians | 83.0 /100 | #151 | Excellent 17.1% |
| Immigrants | Indonesia | 82.7 /100 | #152 | Excellent 17.1% |
| Immigrants | Kazakhstan | 80.5 /100 | #153 | Excellent 17.1% |
| Immigrants | Malaysia | 79.3 /100 | #154 | Good 17.1% |
| Brazilians | 78.9 /100 | #155 | Good 17.1% |
| Sri Lankans | 78.9 /100 | #156 | Good 17.1% |
| Immigrants | Australia | 76.0 /100 | #157 | Good 17.1% |
| Celtics | 74.1 /100 | #158 | Good 17.1% |